Fig. 3.

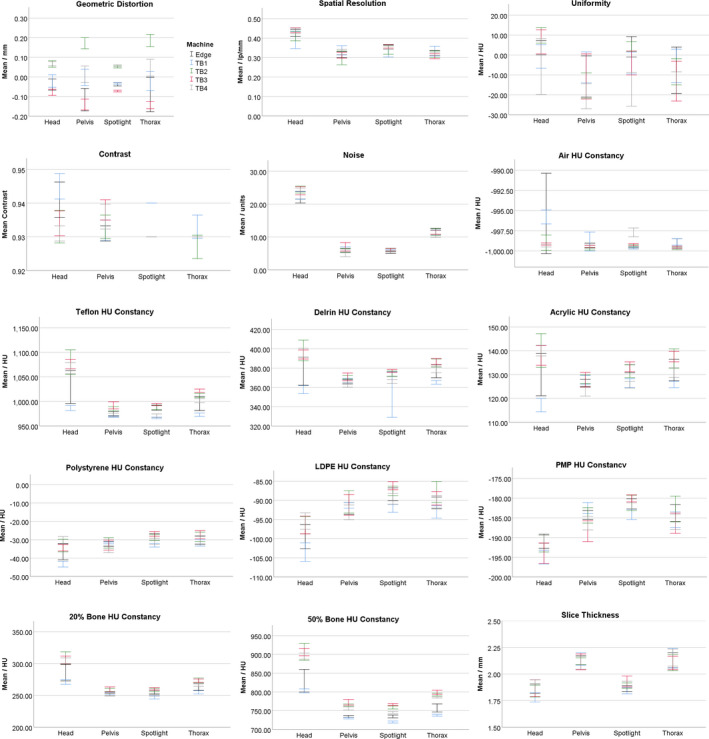
Institutional data (N = 200) for all image quality parameters separated by technique and machine and used for the two‐way ANOVA test. Error bars represent a 95% confidence interval.

Institutional data (N = 200) for all image quality parameters separated by technique and machine and used for the two‐way ANOVA test. Error bars represent a 95% confidence interval.