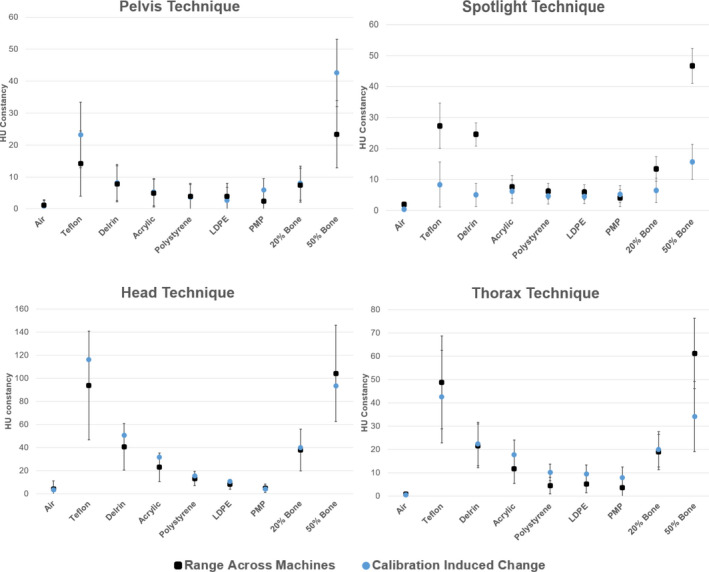
Fig. 4.

The maximum change in the average value of each HU plug caused by recalibration of the cone‐beam computed tomography imager plotted along with the range of expected values after calibration seen across all machines. Error bars are the largest, single machine standard deviation computed from post‐calibration data intra‐machine for each parameter.
