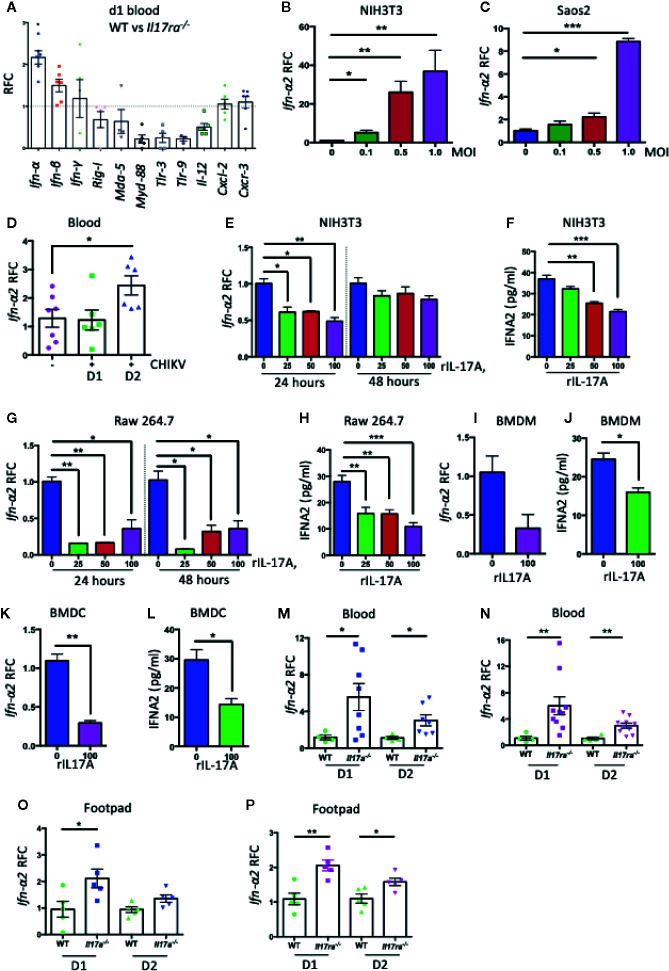
Figure 3.
IL-17A down-regulates the expression of Ifn-α2. (A) Seven to eight weeks old WT (n = 5) and Il17ra−/− mice (n = 6) were infected with 1 × 10⁵ PFU of CHIKV via footpad and the transcripts of indicated genes in blood were measured at day 1 post-infection by QPCR and normalized to β-actin mRNA. (B) NIH3T3 and (C) Saos2 cells were infected with CHIKV for 24 h, and the transcript level of Ifn-α2 was measured by QPCR and normalized to β-actin mRNA. (D) Seven to eight weeks old WT mice were mock infected (n = 7) or infected with 1 × 10⁵ PFU of CHIKV (n = 6) via footpad and the expression of Ifn-α2 was measured by QPCR in the blood at indicated time points and normalized to β-actin mRNA. (E) NIH3T3 cells were infected with CHIKV (MOI = 1) and treated with indicated concentrations of rIL-17A for 24 and 48 h. The expression of Ifn-α2 was measured by QPCR and normalized to cellular β-actin mRNA. (F) The protein level of IFN-α2 was measured by ELISA in NIH3T3 cells infected with CHIKV (MOI = 1) and treated with different concentrations of rIL-17A. (G, H) Raw 264.7 cells were infected with CHIKV (MOI = 1) in the presence of indicated concentrations of rIL-17A and incubated for 24 and 48 h followed by the measurement of mRNA level (G) and protein level (H) of IFN-α2. (I–L) Mouse bone marrow derived-macrophages (I, J) and dendritic cells (K, L) were infected with CHIKV (MOI = 1) for 48 h in the presence of rIL-17A (100 ng/ml). The level of Ifn-α2 was measured either by QPCR normalized to cellular β-actin mRNA or by ELISA. (M, N) WT (n = 4), Il17a−/− (n = 8) and Il17ra−/− mice (n = 10) were infected with 1 × 10⁵ PFU of CHIKV via footpad. Blood was collected on days 1 and 2 post-infection, and the mRNA level of Ifn-α2 was measured by QPCR and normalized to β-actin mRNA between WT and Il17a−/− mice (M), and WT and Il17ra−/− mice (N). Ifn-α2 mRNA levels in the footpads of Il17a−/− mice (O) and Il17ra−/− mice (P) were measured by QPCR and normalized to β-actin mRNA. All the data represent at least two independent experiments performed in triplicates and analyzed by one-way ANOVA followed by Turkey’s test, (*, **, and *** denote p < 0.05, p < 0.01, and p < 0.001 respectively, when compared to untreated control).

