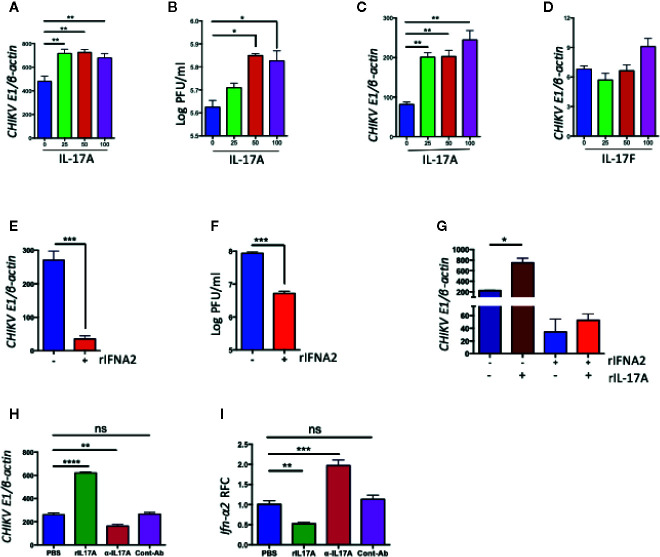
Figure 4.
IL-17A, but not IL-17F, promotes CHIKV replication in NIH3T3 cells. (A, B) NIH3T3 cells were infected with CHIKV (MOI =1) in the presence of indicated concentrations of rIL-17A for 48 h. The ratio of CHIKVE1 to cellular β-actin transcripts was determined by QPCR (A) and the number of infectious virus in the culture supernatants were measured by a plaque assay (B). (C) NIH3T3 cells were preincubated for 24 h with indicated concentrations of rIL-17A, then infected with CHIKV (MOI = 1) for an additional 48 h. The ratio of CHIKVE1 RNA to cellular β-actin transcripts was determined by QPCR. (D) NIH3T3 cells were infected with CHIKV (MOI = 1) in the presence of IL-17F for 48 h, and the ratio of CHIKVE1 RNA to cellular β-actin transcripts was determined by QPCR. (E, F) NIH3T3 cells were treated with recombinant IFNA2 for 8 h and then infected with CHIKV at 1 MOI for 24 h. The ratio of CHIKVE1 to cellular β-actin transcripts was determined by QPCR (E) and the infectious virus in the cell medium were measured by a plaque assay (F). (G) NIH3T3 cells were treated with rIL-17A and IFNA2, then infected with CHIKV at 1 MOI for 24 h. The ratio of CHIKVE1 to cellular β-actin transcripts was measured by QPCR. (H, I) NIH3T3 cells were infected with CHIKV (1 MOI) in the presence of rIL-17A, IL-17A neutralizing antibody or anti-flavivirus 4G2 antibody as an isotype control for 24 h. The ratio of CHIKVE1 to cellular β-actin mRNA was determined by QPCR (H) and the expression of Ifn-α2 was measured by QPCR and normalized to cellular β-actin mRNA (I). All the data represent at least two independent experiments performed in triplicates and analyzed by one-way ANOVA followed by Turkey’s test, (*, **, and *** denote p < 0.05, p < 0.01, and p < 0.001, respectively, when compared to untreated control). ns denotes not significant.

