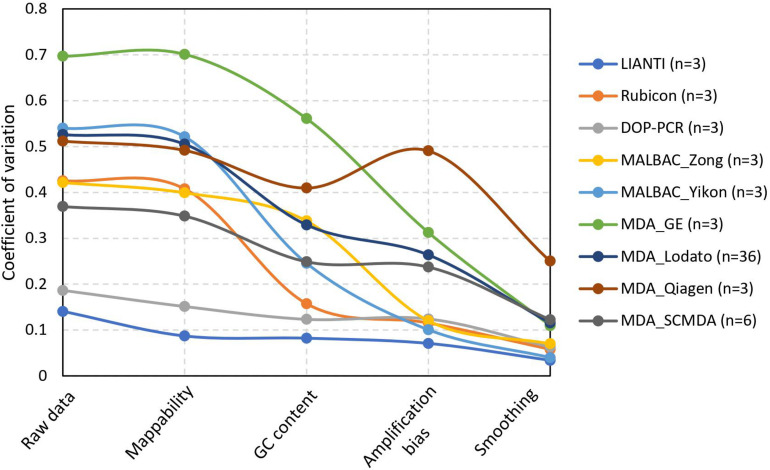
FIGURE 3.
Decreased coefficient of variation by normalization steps in SCCNV. Each line presents the average CV of normalized sequencing depths of multiple single cells amplified using the same experimental procedures. See Supplementary Table 1 for citations and SRA ids of each experimental batch.

