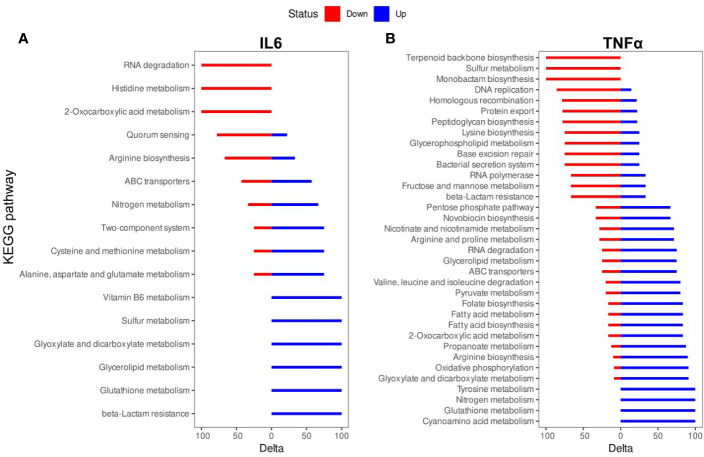
Figure 3.
Kyoto Encyclopedia of Genes and Genomes (KEGG) pathway enrichment analysis of differentially expressed genes (DEGs): (A) IL-6 vs. control; (B). TNFα vs. control. The names of KEGG pathways are placed along the Y-axis. The X- axis represents the values of the Delta. Downregulated genes are shown in red color. Upregulated genes are show in blue color.

