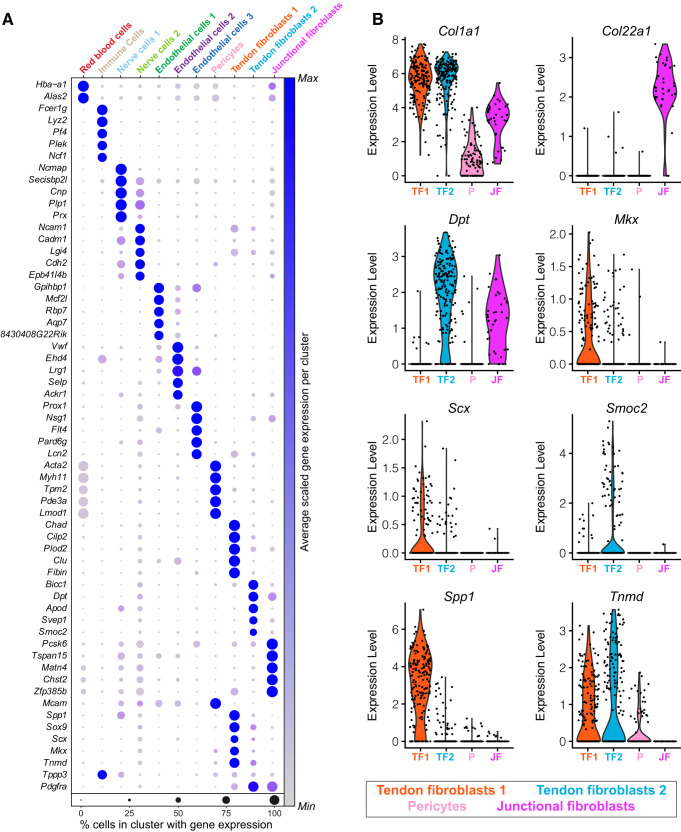
Fig. 2.
Visualization of genes enriched in specific cell populations. A: average expression of gene sets that are differentially enriched in each cell type. B: violin plots of expression levels for select tendon genes in tendon fibroblasts (TF1, TF2), junctional fibroblasts (JF), and pericyte (P) cell populations. n = 4 mice.

