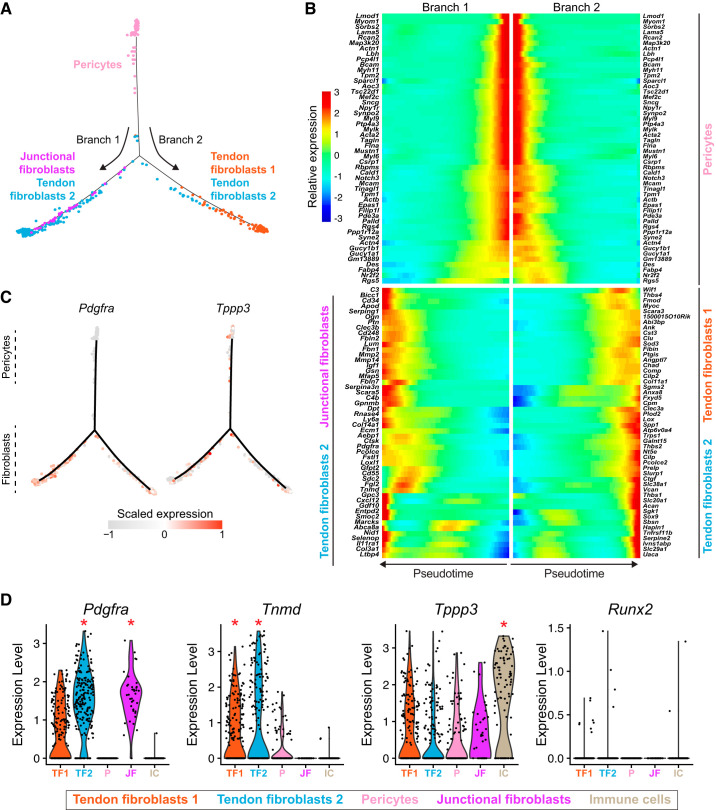
Fig. 5.
Pseudotime lineage trajectory analysis of pericytes. A: branched pseudotime trajectory of pericytes into different tendon fibroblast populations. B: heat map demonstrating the top 50 genes in that are expressed across pseudotime progression from pericytes to tendon fibroblasts and junctional fibroblasts subpopulations. C: log z-scaled relative expression of Tppp3 and Pdgfra along the pseudotime trajectory. D: violin plots for select tendon and osteoblast genes. *The gene is differentially expressed (q < 0.05) compared with the other 11 subpopulations. n = 4 mice.

