Fig. 6.
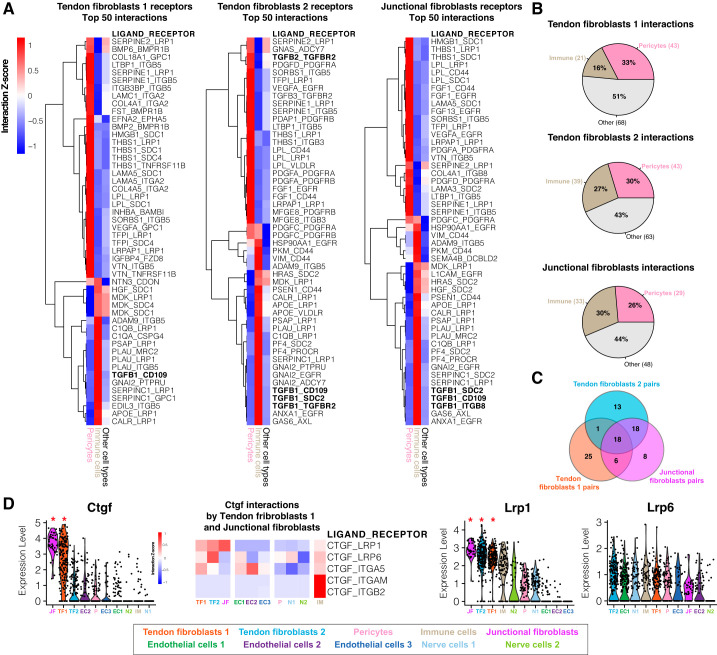
Ligand-receptor interaction model. A: heat map of row-normalized (z-score) ligand-receptor interactions scores. Scores are calculated from multiplying the expression value of receptors differentially expressed in fibroblasts subpopulations (tendon fibroblasts 1, 2, and junctional fibroblasts, compared with other cell types) with the expression value of ligands expressed by pericytes and immune cells or other cell types. Rows represent ligand-receptor pairs, whereas columns represent the cell type expressing the ligand. A positive interaction z-score indicates that the pair has a high score for a particular ligand and cell type (pericytes, immune cells) compared with other cell types. Only the top 50 interactions ranked by score enriched in pericyte and immune cells are displayed. B: percentage of total interactions detected by the model enriched in pericytes, immune cells, or other cell types. C: Venn diagram representing the total interactions pairs shared between fibroblast subpopulations. D: violin plots for ligand-receptor genes ranked by average expression value. *The gene is differentially expressed (q < 0.05) within the data set. Heat map of row-normalized ligand-receptor interactions scores involving the Ctgf ligand differentially expressed by the tendon fibroblasts 1 and junctional fibroblasts subpopulations, and receptors identified by the model that are expressed by other cell types.

