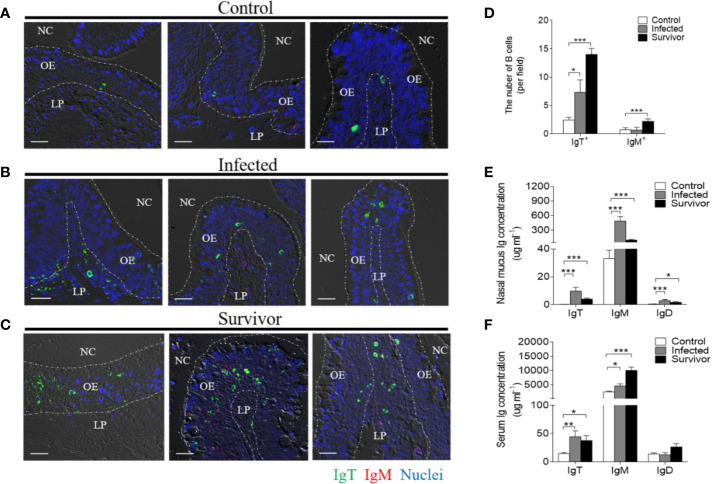
Figure 3.
Responses of IgT+ B cells and Igs in the olfactory organ of trout infected with F. columnare. (A–C) Differential interference contrast images of immunefluorescence staining on paraffinic sections of olfactory organ from control fish (A), infected fish (28 dpi, B) and survivor fish (75dpi, C). IgT+ and IgM+ B cells were stained with rabbit anti-trout IgT (green) and mouse anti-trout IgM (red), respectively; nuclei were stained with DAPI (blue) (isotype-matched control antibody staining, Supplemental Figure 2). (D) The number of IgT+ and IgM+ B cells in paraffinic sections of olfactory organ from control fish, infected fish (28 dpi), and survivor fish (75 dpi) (n = 6 fish per group). (E, F) Concentration of IgT, IgM, and IgD in nasal mucus (E) and serum (F) of control, infected (28 dpi), and survivor fish (75 dpi) (n = 12 per group). NC, nasal cavity; OE, olfactory epithelium; LP, lamina propria. Scale bar, 20 μm. *p < 0.05, **p < 0.01, ***p < 0.001 (one-way ANOVA with Bonferroni correction). Data in (D–F) are representative of at least three independent experiments (mean ± SEM).

