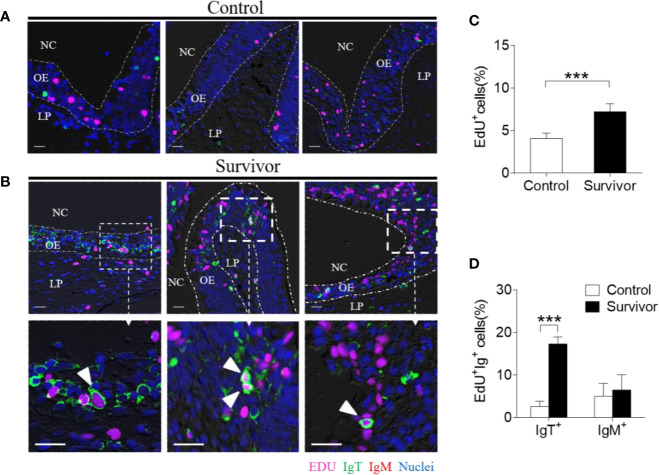
Figure 5.
Proliferation of IgT+ B cells in the olfactory organ from survivor fish. (A, B) Immunofluorescence analysis of 5-ethynyl-2’-deoxyuridine (EdU) incorporation by IgT+ or IgM+ B cells in the olfactory organ of control (A) and survivor fish (B) and enlarged images of the areas outlined. Paraffinic sections of olfactory organ were stained for EdU (magenta), trout IgT (green), trout IgM (red), and nuclei (blue) detection. White arrowheads point to cells double stained for EdU and IgT. NC, nasal cavity; OE, olfactory epithelium; LP, lamina propria. Scale bars, 20 μm. (C) Percentage of EdU+ cells from total olfactory organ cells in control and survivor fish counted from A and B (n = 6 fish per group). We have counted 18 fields or 19 fields in the control or survivor group, respectively. (D) Percentage of EdU+ cells from the total olfactory organ IgT+ and IgM+ B cell populations in control and survivor fish, statistically calculated from A and B. ***p < 0.001 (unpaired Student t test). Data in (C, D) are representative of at least three independent experiments (mean ± SEM).

