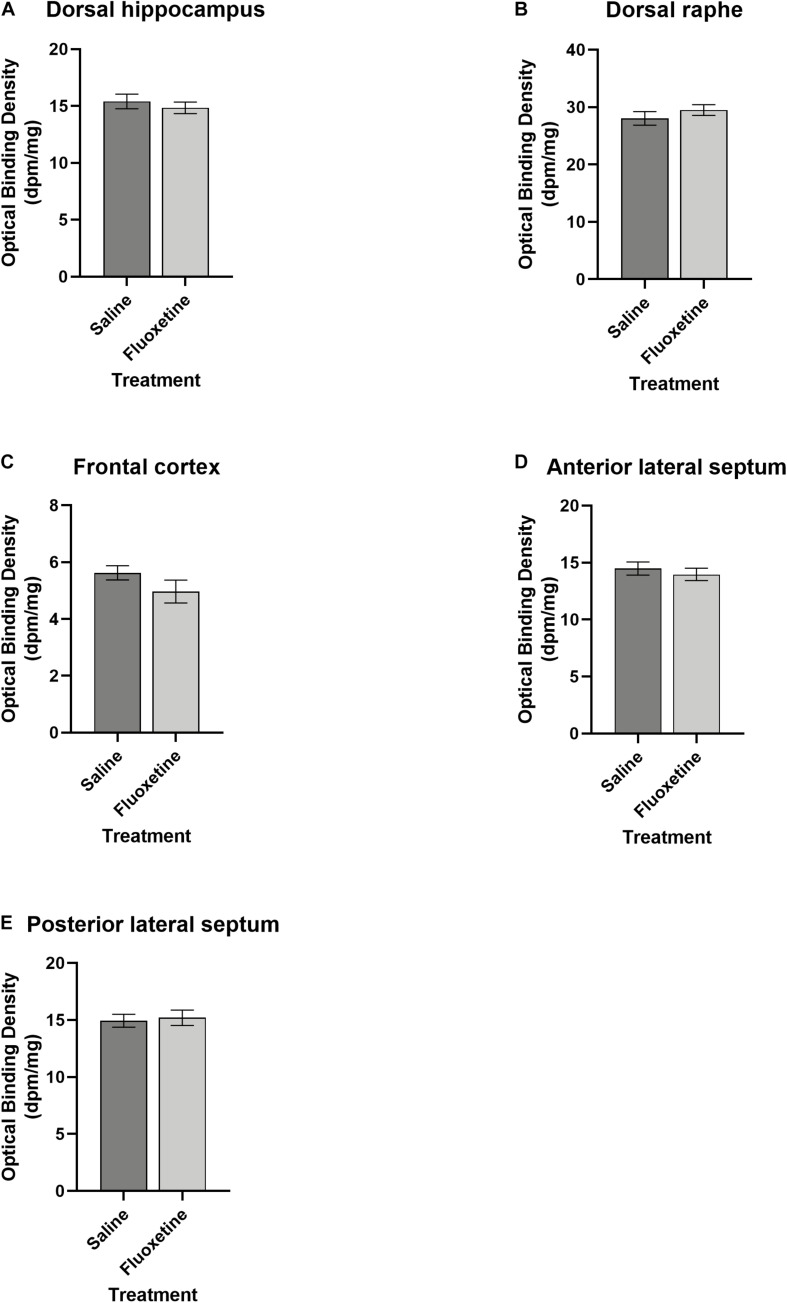
FIGURE 11.
Serotonin receptor 1a binding. (A) Mean (±SEM) optical binding density in the dorsal hippocampus comparing saline and fluoxetine exposure. (B) Mean (±SEM) optical binding density in the dorsal raphe comparing saline and fluoxetine exposure. (C) Mean (±SEM) optical binding density in the frontal cortex comparing saline and fluoxetine exposure. (D) Mean (±SEM) optical binding density in the anterior lateral septum comparing saline and fluoxetine exposure. (E) Mean (±SEM) optical binding density in the posterior lateral septum comparing saline and fluoxetine exposure.

