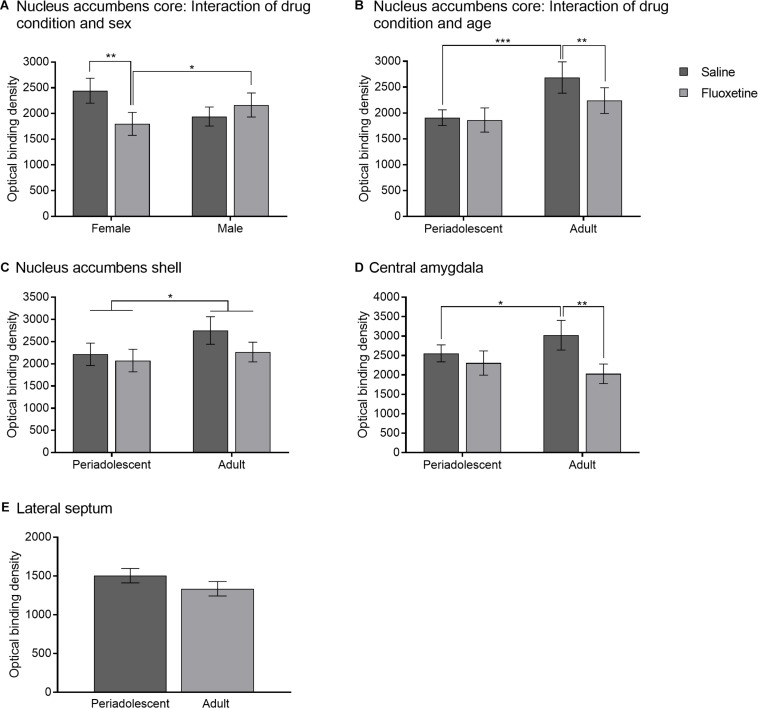
FIGURE 8.
Oxytocin receptor binding. (A) Mean (± SEM) optical binding density in the nucleus accumbens core comparing saline and fluoxetine exposure by sex. (B) Mean (±SEM) optical binding density in the nucleus accumbens core comparing saline and fluoxetine exposure by age. (C) Mean (±SEM) optical binding density in the nucleus accumbens shell comparing saline and fluoxetine exposure by age. (D) Mean (±SEM) optical binding density in the central amygdala comparing saline and fluoxetine exposure by age. (E) Mean (±SEM) optical binding density in the lateral septum comparing saline and fluoxetine exposure. *p < 0.05, **p < 0.01, ***p < 0.001.

