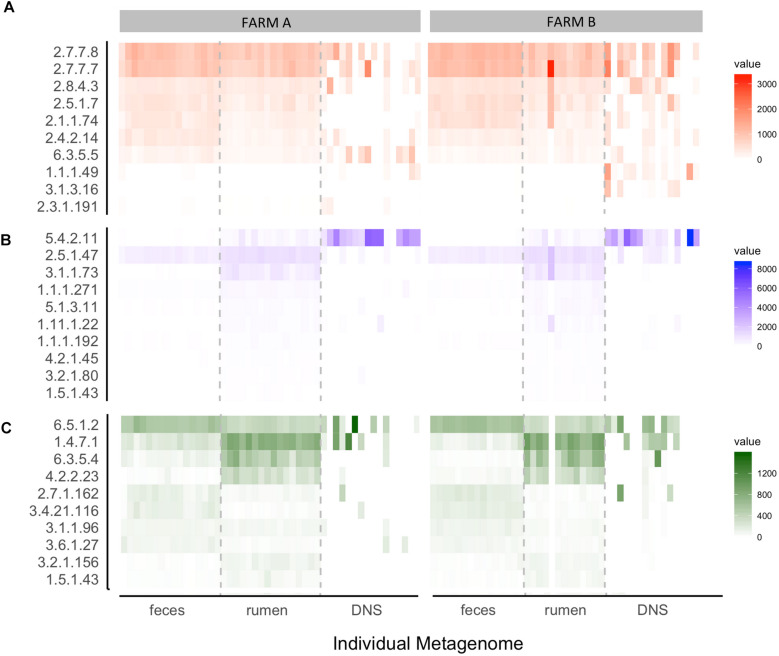
FIGURE 6.
Heat map of the top 10 ECs selected by how well they distinguish (A) farm, (B) body site, and (C) farm given body site. Each box represents an individual sample and is shaded by its normalized read count value. Samples are stratified by farm (A,B) and body site from which the sample was taken [feces, rumen fluid, and deep nasal swab (DNS)]. ECs (Number: Class) = (A) 2.7.7.7: Nucleotidyltransferase, 2.7.7.8: Nucleotidyltransferase, 2.8.4.3: Methylsulfanyl transferase, 2.5.1.7: Alkyltransferase, 2.1.1.74: Methyltransferase, 2.4.2.14: Pentosyltransferase, 6.3.5.5: Carbon-nitrogen ligase, 1.1.1.49: Oxidoreductase, 3.1.3.16: Phosphoric - monoester hydrolase, 2.3.1.191: Acyltransferase. (B) 5.4.2.11: Phosphotransferase, 2.5.1.47: Alkyltransferase, 3.1.1.73: Carboxylic-ester hydrolase, 1.1.1.271: Oxidoreductase, 5.1.3.11: Epimerase, 1.1 1.1.22: Peroxidase, 1.1.1.192: Oxidoreductase, 4.2.1.45: Lyase, 3.2.1.80: Glycosylase, 1.5.1.43: Oxidoreductase. (C) 6.5.1.2: DNA ligase, 1.4.7.1: Oxidoreductase, 6.3.5.4: Carbon-Nitrogen Iigase, 4.2.2.23: Carbon-oxygen lyase, 2.7.1.162: Phosphotransferase, 3.4.21.1 16: Peptide hydrolase, 3.1.1.96: Carboxylic-ester hydrolase, 3.6.1.27: Nydr6lase, 3.2.1.156: Oiigosaccharide reducing-end xylanase, 1.5.1.43: Oxidoreductase.

