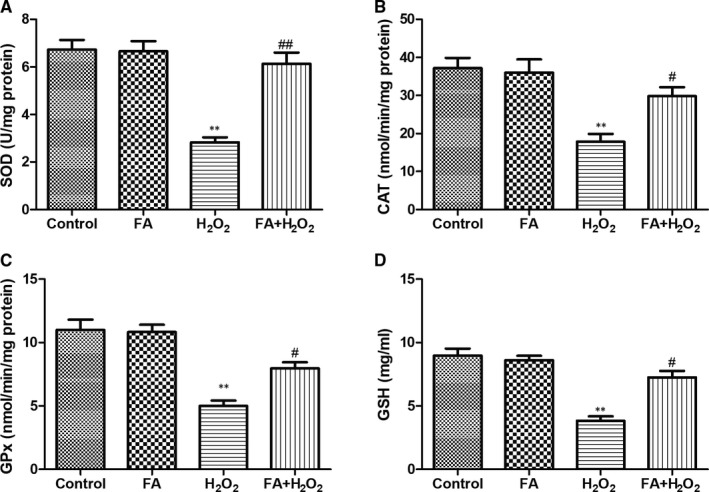
Figure 6.

The effect of FA pre‐treatment on antioxidant status in ARPE‐19 cells. A, The effect of FA pre‐treatment on SOD activity in ARPE‐19 cells; (B) The effect of FA pre‐treatment on CAT activity in ARPE‐19 cells; (C) The effect of FA pre‐treatment on GSH‐PX activity in ARPE‐19 cells; (D) The effect of FA pre‐treatment on GSH level in ARPE‐19 cells. ARPE‐19 cells were pre‐treated with FA (5 mM) for 24 h and then treated with H2O2 (300 μM) for 4 h. Each column presented means ± SD (n = 3). ** P < .01 vs normal control group. # P < .05, ## P < .01 vs H2O2‐treated group
