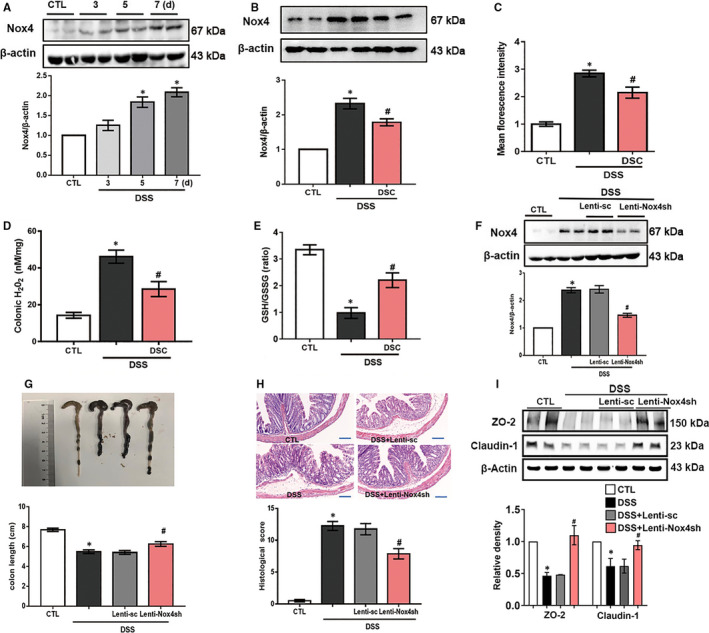
Figure 3.

DSC ameliorates Nox4 expression and ROS production. A, Colitis was induced as described in Materials and Methods, and the colonic tissues were collected as indicated periods. Representative bands and quantitative analysis of Nox4 in colonic tissues were shown. B‐F, Colitis was induced as described in Materials and Methods and treated with or without DSC (50 mg/kg). B, Representative bands and quantitative analysis of Nox4 in colonic tissues. C, Representative images and quantitative analysis of ROS production by DHE staining in colonic tissues, scale bar = 100 μm. D, Quantitative analysis of GSH/GSSG ratio. E, Quantitative analysis of tissue H2O2 production. Colitis was induced as described in Materials and Methods and treated with or lentiviral Nox4 shRNA. F, Representative bands and quantitative analysis of Nox4 in colonic tissues. G, Representative images and quantitative analysis of colon length. H, Representative images of H&E staining and histological score. I, Representative bands and quantitative analysis of ZO‐2 and claudin‐1 expression in colonic tissues. β‐actin was used as loading control. Data shown are means ± SEM of n = 8 in each group. *P < 0.05 vs Control (CTL), #P < 0.05 vs DSS‐treated mice
