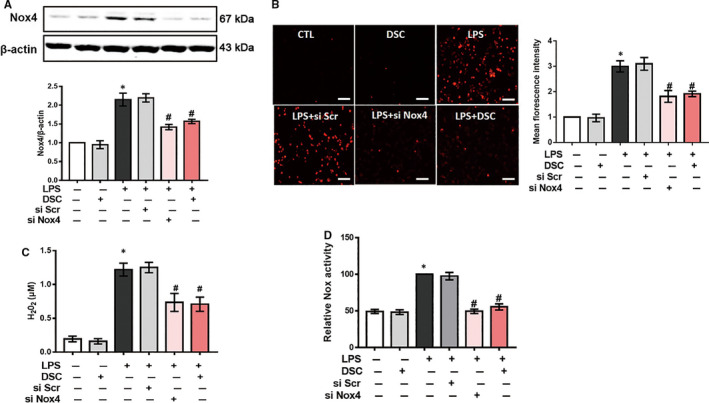
Figure 4.

DSC inhibits Nox4‐mediated redox imbalance in BMDM. BMDM was treated with or without DSC (50 μmol/L) or Nox4 siRNA as described in Materials and Methods. A, Representative bands and quantitative analysis of Nox4. B, Representative images and quantitative analysis of mitochondrial ROS production. C, Quantitative analysis of intracellular H2O2 generation. D, Quantitative analysis of NADPH oxidase activity. Data shown are means ± SEM of n = 8 in each group. *P < 0.05 vs Control cell (CTL), #P < 0.05 vs LPS‐stimulated BMDM
