Figure 3.

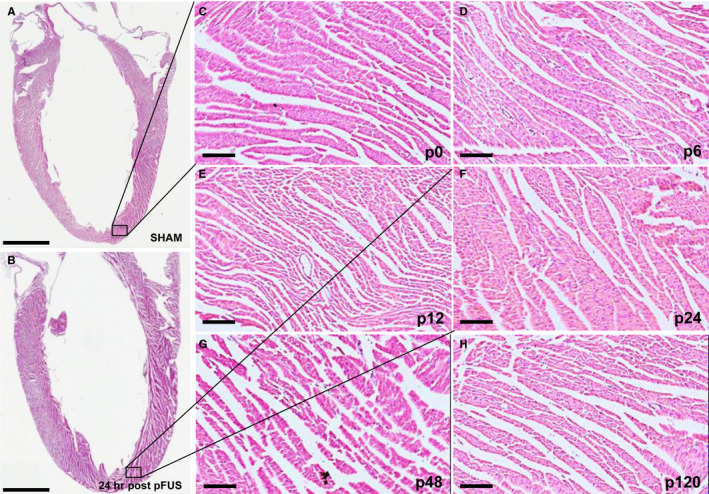
Time course of histologic evaluation of cardiac tissue following pFUS treatment (n = 3/group). A and B, Long axis LV sections of H&E staining in SHAM and 24 h post‐pFUS shows no detectable morphologic changes. Black boxes represent the regions of magnification. C‐H, Time course of morphologic analysis by H&E staining revealed that pFUS treatment did not result in macroscopic damages in apical myocardium. Scale bar = 2 mm (A‐B) and 100 µm (C‐H). C‐H represents Sham (p0), post‐6 (p6), post‐12 (p12), post‐24 (p24), post‐48 (p48) and post‐120 (p120) hrs at post‐pFUS, respectively
