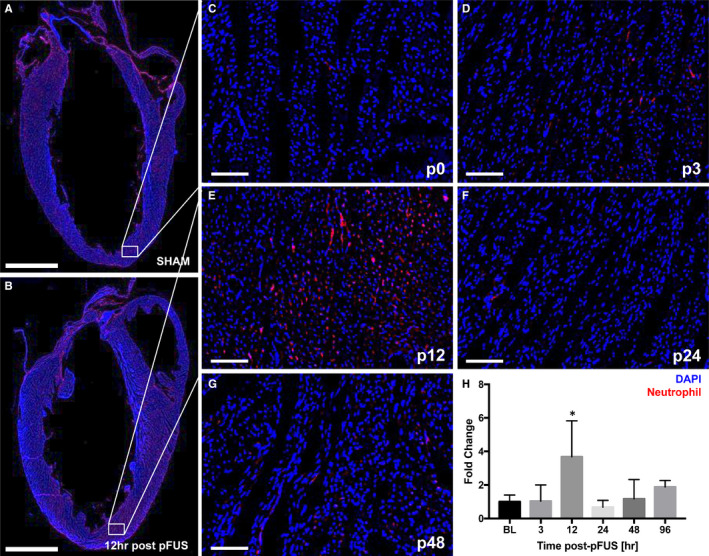
Figure 4.

fIHCs of neutrophil infiltration in the pFUS‐targeted myocardium (n = 3/group). A and B, Long axis LV section of the fIHC in SHAM and post‐pFUS shows the significantly higher number of neutrophils (HIS48+ cells) was observed at post‐12 h compared with the SHAM. White box represents the region of interest in the heart. C‐G, Time course of neutrophil infiltration revealed that pFUS treatment resulted in significant number of neutrophils in pFUS‐targeted region at post‐12 h. H, Quantification of neutrophil positive staining in the ROI at difference time points. C‐G represents Sham (p0), post‐3 (p3), post‐12 (p12), post‐24 (p24) and post‐48 (p48) hours at post‐pFUS, respectively. Red colour represents the neutrophils (HIS48+ cells). Asterisks represent the statistical significance set at P < .05 based on ANOVA. Scale bar = 2 mm (A) and 100 µm (D‐M)
