Figure 7.

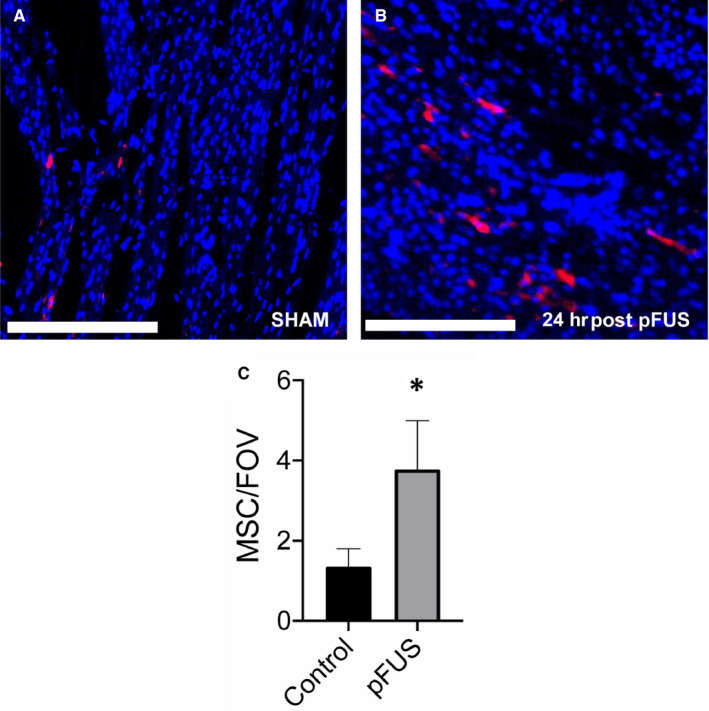
fIHC of anti‐human mitochondrial staining of pFUS targeted and controls rats (n = 3/group) following 24 h after infusion of human MSC. A and B, the ROI of the SHAM and pFUS‐targeted myocardium, respectively. C, Quantitative analysis of numbers of human MSC (red) in rat myocardium compared with controls. Asterisks represent the statistical significance set at P < .05 based on ANOVA. Scale bar = 300 µm
