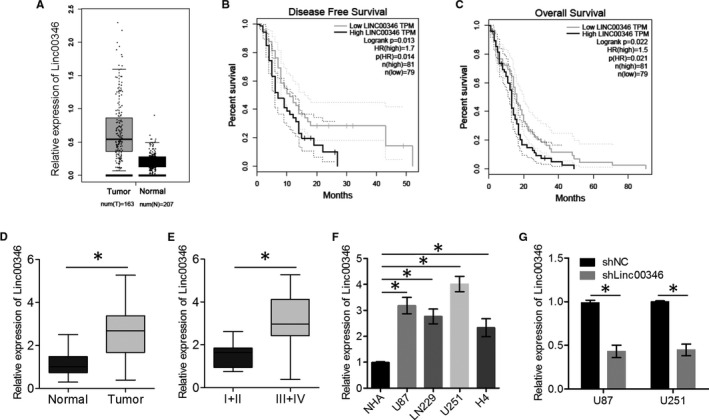
FIGURE 1.

LINC00346 expression in glioma tissues and cell lines. A, Expression levels of LINC00346 in GEPIA clinical samples (normal brain tissue and GBM) are presented as a box and whisker plot. B,C, Disease‐free (DFS) and overall (OS) survival rates were computed from TCGA and GTEx data on the GEPIA server. D, The expression levels of LINC00346 in 20 glioma tissue samples and 20 normal brain tissue samples were measured by qRT‐PCR. E, The expression levels of LINC00346 in gliomas of different clinical grades. WHO grade I + II, n = 7; II + IV, n = 13. F, The expression levels of LINC00346 in glioma cell lines and NHAs were determined by qRT‐PCR. U87 and U251 cells were transfected with either shLINC00346 or shNC, and LINC00346 expression was determined by qRT‐PCR. * P < .05
