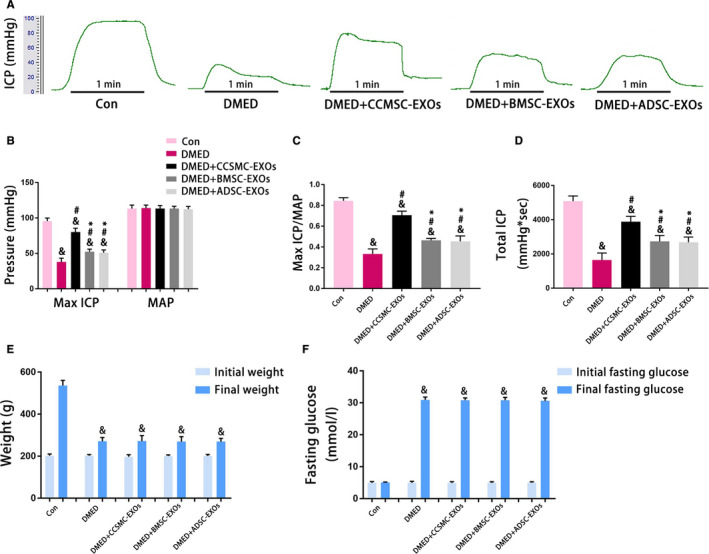
FIGURE 4.

Evaluation of erectile function and metabolic indexes. (A) Representative ICP traces measured by stimulating the cavernous nerves with 5 V for 1 min. (B) The max ICP and MAP values for each group are presented as a bar graph. (C) The max ICP/MAP values for each group are presented as a bar graph to show the erectile function. (D) The total ICP values for each group are presented as a bar graph to show the erectile function. (E) Initial and final weights for each group are presented as a bar graph. (F) Initial and final fasting glucose levels for each group are presented as a bar graph. Data are expressed as the mean ± standard deviation. & P < .05 compared with the Con group. # P < .05 compared with the DMED group. * P < .05 compared with the DMED + CCSMC‐EXO group. CCSMC‐EXOs: exosomes derived from corpus cavernosum smooth muscle cells; BMSC‐EXOs: exosomes derived from bone marrow stem cells; ADSC‐EXOs: exosomes derived from adipose‐derived stem cells; DMED: diabetes mellitus‐induced erectile dysfunction; ICP: intracavernous pressure; MAP: mean arterial pressure
