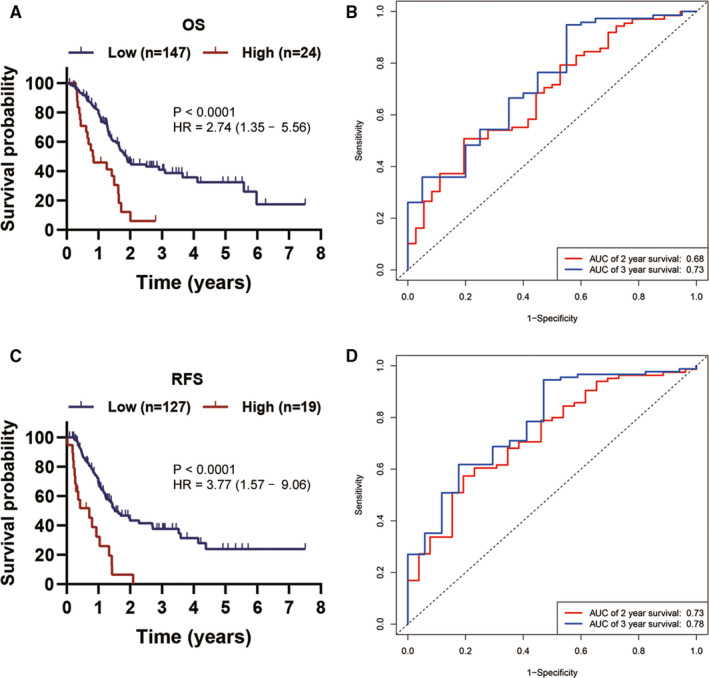
Figure 4.

Establishment of a prognostic signature based on ITGB1, ITGB4, ITGB5 and ITGB6. A, KM survival curve showing OS differences between high‐ and low‐risk groups. B, ROC curve analysis of the signature for 2‐ and 3‐year OS prediction of PC patients. C, KM survival curve showing RFS differences between high‐ and low‐risk groups. D, ROC curve analysis of the prognostic signature for 2‐ and 3‐year RFS prediction of PC patients
