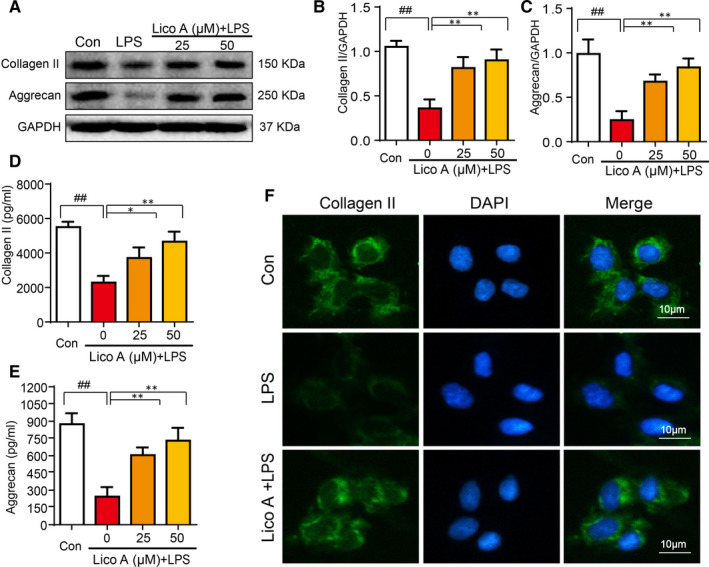
Figure 3.

Effect of Lico A on aggrecan and collagen‐II expression in LPS‐activated mouse chondrocytes. The cells were stimulated with LPS (1 µg/mL) alone or by co‐stimulation with LPS (1 µg/mL) and Lico A for 6 h, and then following treatment of ATP (5 mmol/L) for 30 min. The protein expression levels of aggrecan and collagen‐II treated as above were visualized by Western blot (A‐C). The production of aggrecan and collagen‐II in mice chondrocytes were measure by ELISAs (D‐E). Collagen‐II (F) was detected by immunofluorescence combined with DAPI staining. Values represent the averages ± SD Significant differences between different groups are indicated as ## P < 0.01, vs control group; *P < 0.05, **P < 0.01, vs LPS alone treatment group, n = 5
