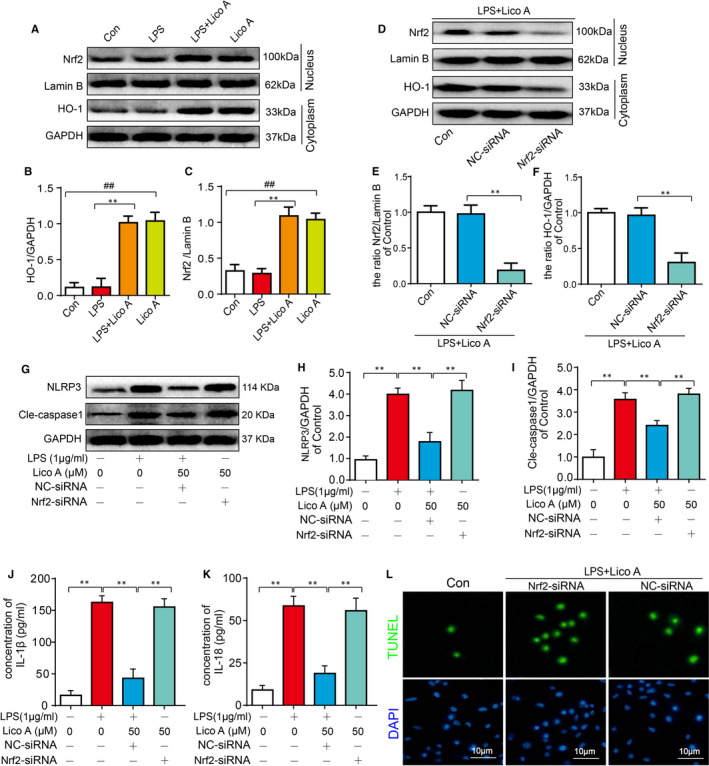
Figure 5.

Involvement of Nrf2 in the effect of Lico A on pyroptosis in mouse OA chondrocytes. The protein expression levels of Nrf2 and HO‐1 treated as above were visualized by Western blot (A‐C). After Nrf2 knock down, the protein expressions of Nrf2 and HO‐1 in chondrocytes treated as above were visualized by Western blot (D) and quantified in (E‐F). The protein expressions of NLRP3 and cleaved‐caspase1 in chondrocytes treated as above were visualized by Western blot (G‐I). The production of IL‑1β and IL‐18 in mice chondrocytes treated as above was measured by ELISA (J‐K). And TUNEL assay was performed in chondrocyte as described above (L). Significant differences between different groups are indicated as ## P < 0.01, vs control group; **P < 0.01, vs LPS alone treatment group, n = 5
