
Figure 1.
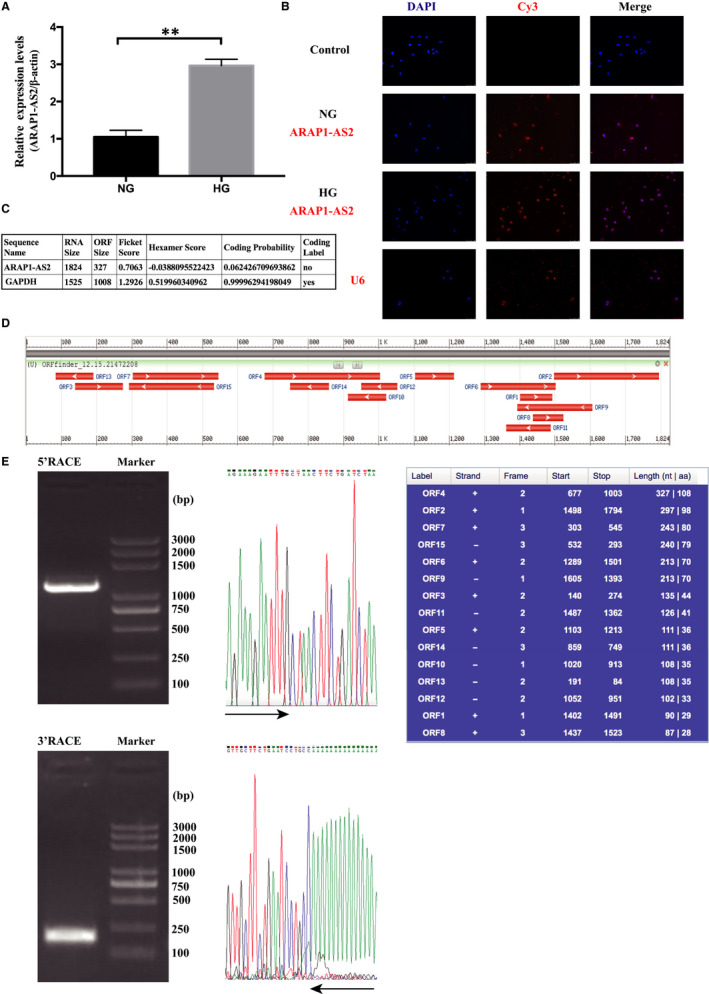
The expression and distribution of ARAP1‐AS2 in HK‐2 cells. A, qRT‐PCR analysis of the expression of ARAP1‐AS2 in HK‐2 cells of the normal‐glucose (NG) group and high‐glucose (HG) group (n = 3); the data are representative of three independent experiments. Data are presented as the mean ± SD. *P < .05, **P < .01, NS, no significant difference. B, Localization of ARAP1‐AS2 (red) in HK‐2 cells that were stimulated by high or normal glucose determined by FISH. ARAP1‐AS2 was mainly distributed in the cell nuclei (×400). Bar = 50 μmol/L. All probes were labelled with Cy3. HK‐2 cells in the control group did not exhibit self‐illumination. C, Coding Potential Assessment Tool (CPAT) was used to test the protein‐coding ability of ARAP1‐AS2. D, ORF finder was used to analyse the protein‐coding ability of ARAP1‐AS2. E, 5′ and 3′ rapid amplification of cDNA ends (RACE) assays in HK‐2 cells were used to detect the whole sequence of ARAP1‐AS2. Left: an image of PCR products from the 5′‐RACE and 3′‐RACE assays separated by gel electrophoresis. Right: sequencing of PCR products indicated the boundary between the universal anchor primer and ARAP1‐AS2 sequences