
Figure 5.
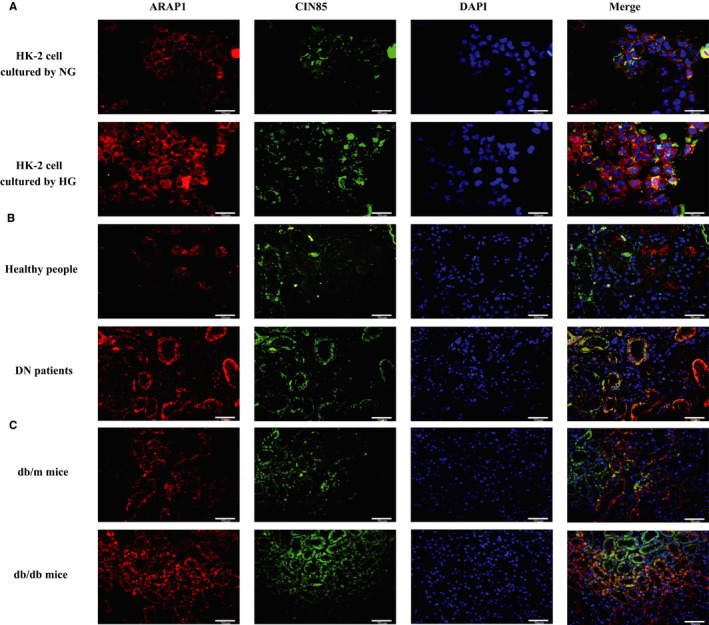
Dual immunofluorescent staining for ARAP1 and CIN85. A, Dual immunofluorescent staining for ARAP1 and CIN85 in HK‐2 cells of the normal‐glucose (NG) group and high‐glucose (HG) group (×400). Bar = 50 μmol/L. B, Dual immunofluorescent staining for ARAP1 and CIN85 in the renal tissues of healthy control and DN patients (×400). Bar = 50 μmol/L. C, Dual immunofluorescent staining for ARAP1 and CIN85 in the renal tissues of normal control and db/db mice (×400). Bar = 50 μmol/L