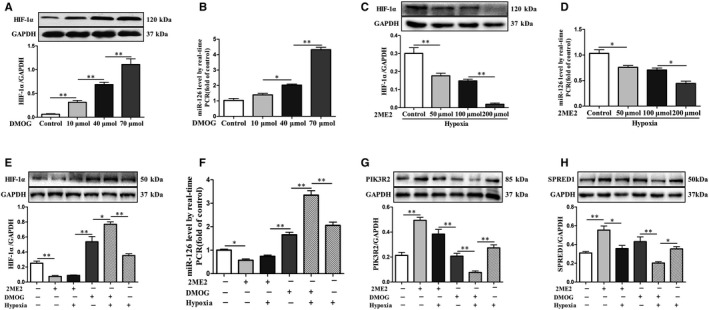
Figure 5.

Expression of HIF‐1α, miR‐126 and its targets in HUVECs treated with DMOG or 2ME2. The expressions level of HIF‐1α (A) and miR‐126 (B) in HUVECs treated with different concentrations of DMOG (10, 40 and 70 μmol) for 6 hours in normoxia. The expressions level of HIF‐1α (C) and miR‐126 (D) in HUVECs treated with different concentrations of 2ME2 (50, 100 and 200 μmol) for 6 hours, followed by 2 hours in hypoxia. The expressions level of HIF‐1α (E), miR‐126 (F), PIK3R2 (G) and SPRED1 (H) in the HUVECs treated with 2ME2 (200 μmol) or DMOG (70 μmol) in either normoxia or hypoxia. Values are expressed as mean ± SD (n = 3/group), *P < .05; **P < .01
