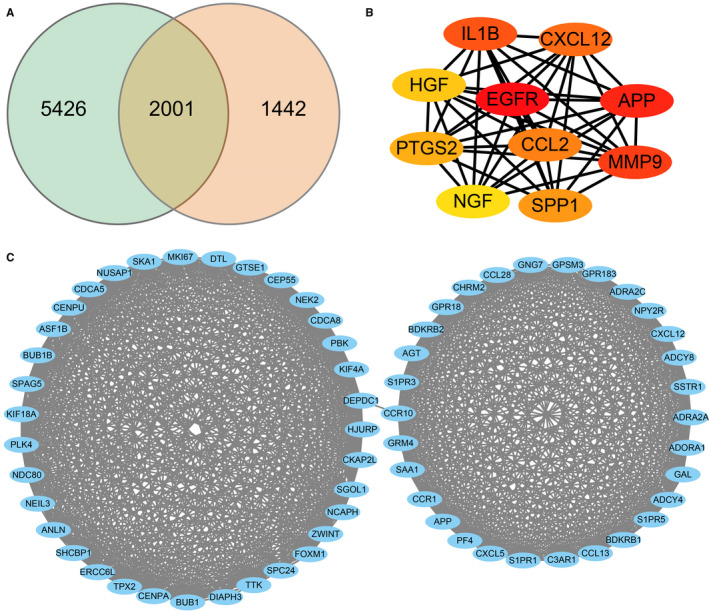
Figure 2.

(A) Venn diagram of the two RNA‐seq datasets (7427 of p8‐2D vs p2‐2D and 3443 of p8‐2D vs p8‐3D). The blue circle indicates datasets of p8‐2D vs p2‐2D, and orange circle indicates datasets of p8‐2D vs p8‐3D. DEGs were selected with fold change >1 and Adjusted P‐value <.05. (B) PPI network of hub genes with 10 nodes and 44 edges. The colour depth of the nodes represents the degree level. The deeper the colour, the higher is the degree. (C) The module with the maximum relevance was obtained from the PPI network with 65 nodes and 991 edges
