
Figure 3.
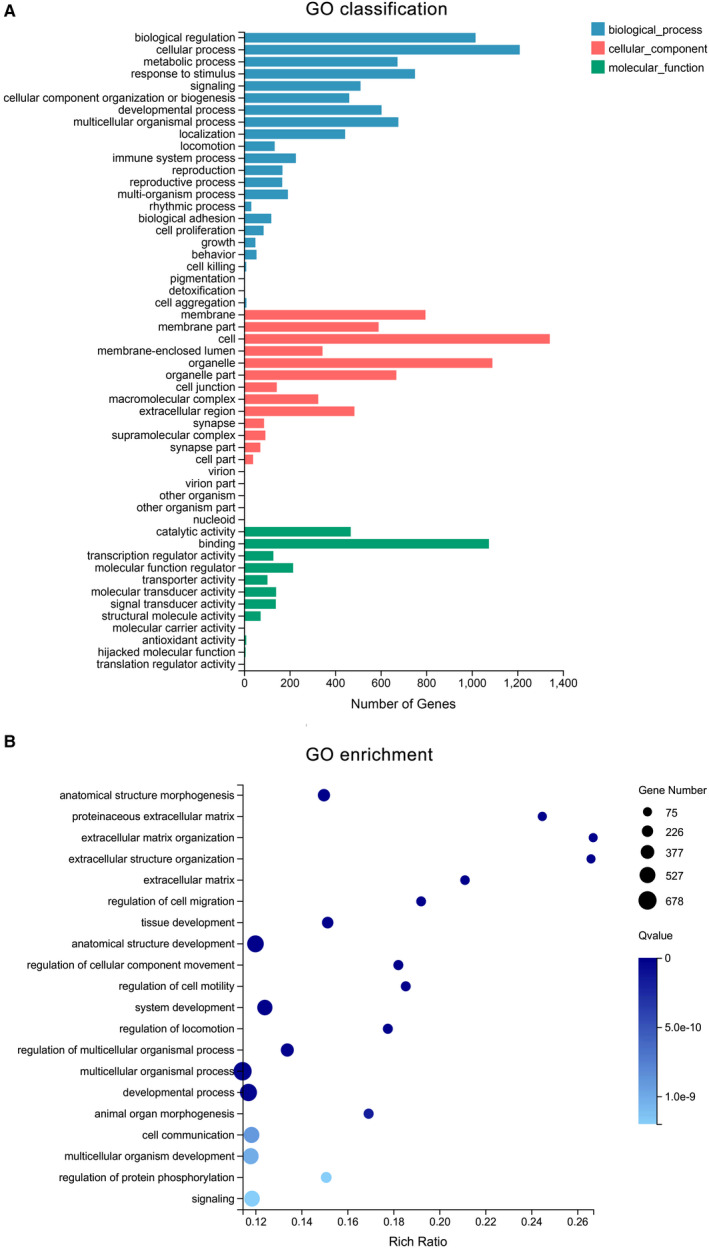
Gene ontology (GO) analysis of DEGs. (A) Blue column means the biological process, whereas the red column means a cellular component, and the green column indicates molecular function. (B) the size of the bubble signifies the gene number; the colour depth represents the Q‐value, whereas the rich ratio indicates the gene number/the total gene number in the y‐axis item