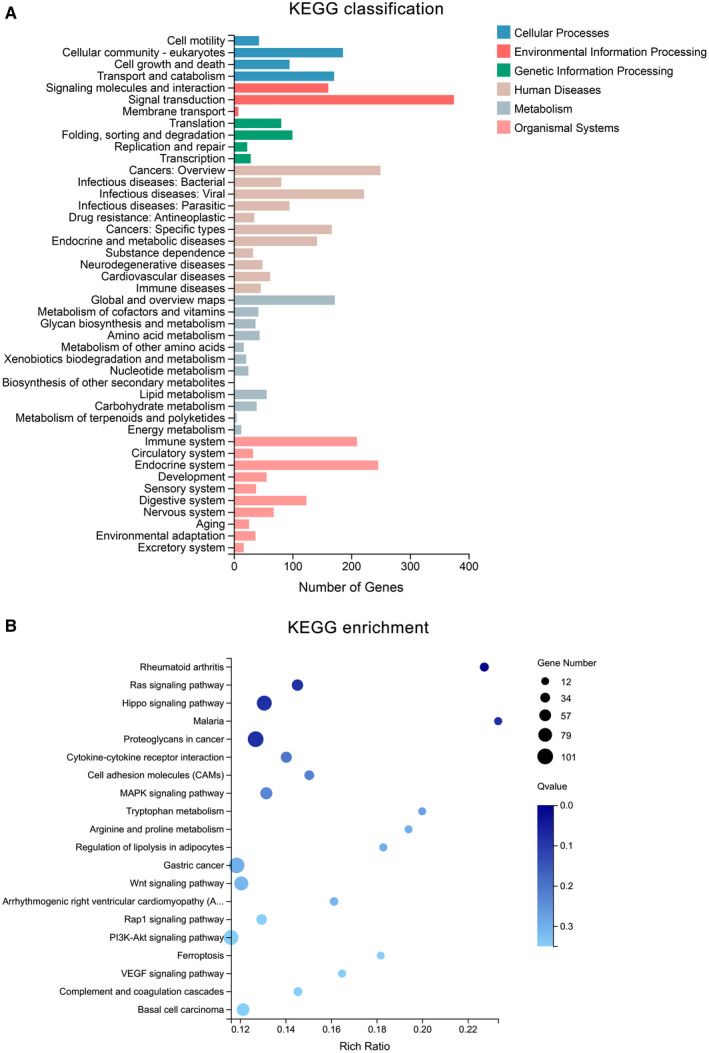
Figure 4.

Kyoto encyclopedia of genes and genomes (KEGG) analysis of DEGs. (A) Blue and red columns mean the cellular process and environmental information processing, respectively. The green column indicates the processing of genetic information processing, whereas the brown column represents human diseases. The grey and pink column indicates the metabolism and organismal system, respectively. (B) The size of the bubble means gene number; the colour depth means Q‐value, and the rich ratio means the gene number/the total gene number in the y‐axis item
