
Figure 4.
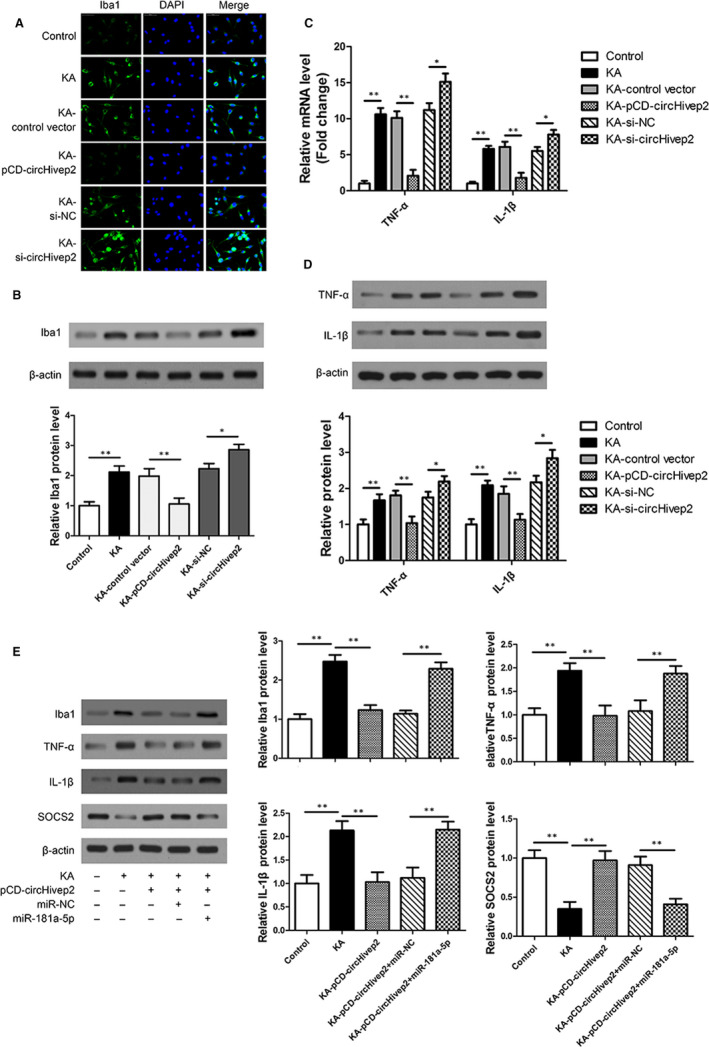
circHivep2 regulates microglial cell activation via the miRNA‐181a‐5p/SOCS2 pathway in vitro. A, Microglia activation was visualized by immunostaining with an anti‐Iba‐1 antibody in kainic acid (KA)‐activated BV‐2 microglial cells with control vector or circHivep2 overexpression plasmid, si‐NC or si‐ circHivep2 (n = 3/group). Scale bar = 50 μm. B, Protein expression level of Iba‐1 was determined by Western blot analysis in KA‐activated BV‐2 microglial cells (n = 3/group). C and D, The mRNA expression (C) and protein expression (D) of TNF‐α and IL‐1β were determined by RT‐qPCR and Western blotting in BV‐2 microglial cells in response to KA with or without circHivep2 knockdown or overexpression treatments (n = 3/group). E, Western blotting analysis of miR‐181a‐5p overexpression on the protein expression of Iba‐1, TNF‐α and IL‐1β, SOCS2 in KA‐activated BV‐2 microglia cells with control vector or circHivep2 overexpression plasmid (n = 3/group). The densities of the Iba1, TNF‐α and IL‐1β, SOCS2 bands were normalized to the β‐actin bands for each sample. Data are the means ± SD. *P < .05, **P < .01. Student's t test or two‐way ANOVA