
Figure 6.
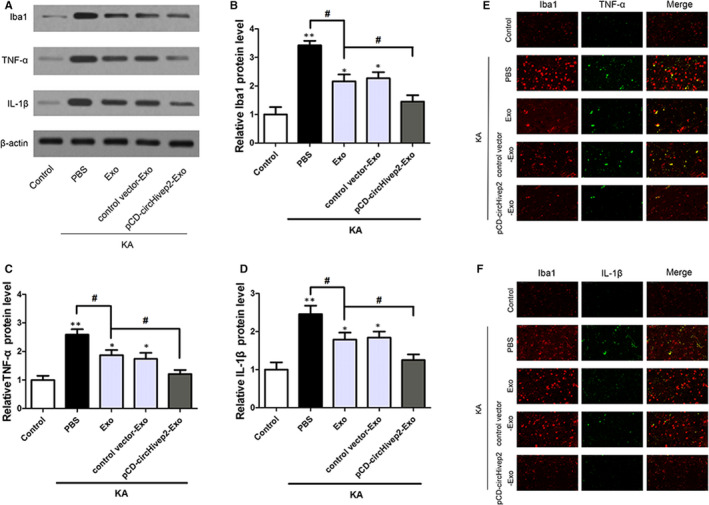
CircHivep2+ exosomes inhibited microglial activation and inflammatory response in the mouse model of epilepsy. A, Western blotting analysis of the protein expression of Iba‐1, TNF‐α and IL‐1β in hippocampus tissues of mice with KA‐induced epilepsy (n = 3‐4/group). Quantification of the protein expressions of Iba‐1 (B), TNF‐α (C) and IL‐1β (D). *P < .05, **P < .01, vs Control; # P < .05, vs Exo‐KA. Student's t test or two‐way ANOVA. E and F, Representative fluorescence micrographs of Iba1 (red) and TNF‐α (green), Iba1 (red) and IL‐1β (green) expression in the hippocampus of kainic acid (KA)‐induced mice with or without PBS, circHivep2+ exosomes or exosomes for 72 h. Scale bar = 50 μm. (n = 3/group)