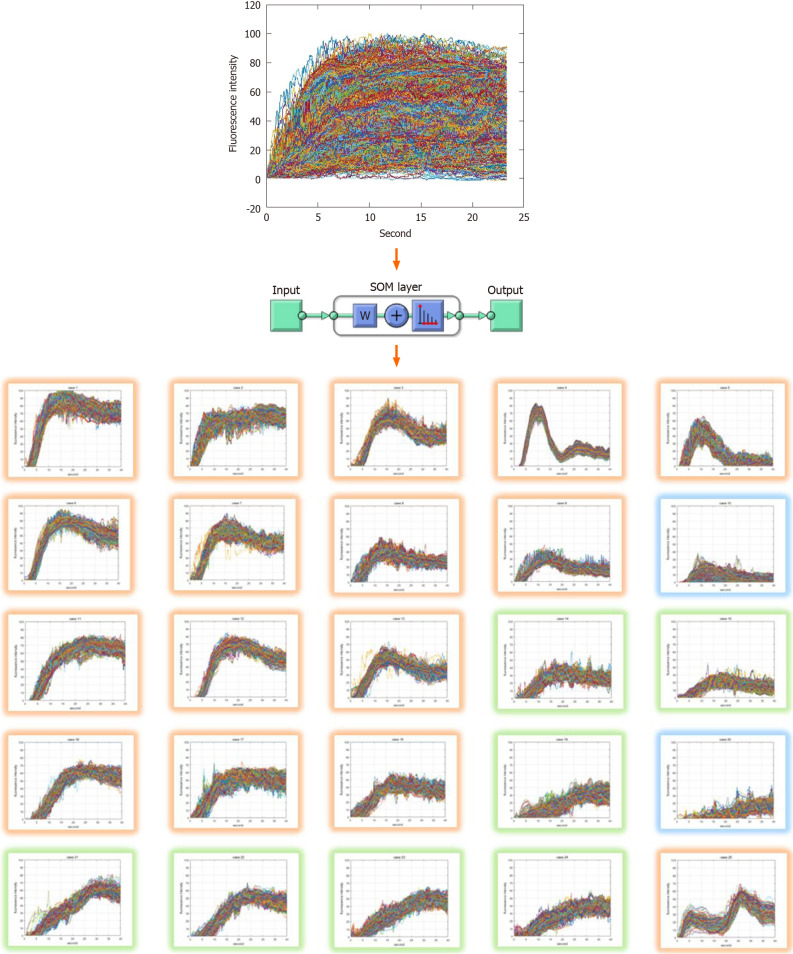
Figure 1.
Classified indocyanine green curve patterns as the results of self-organizing map clustering. The input training data set of self-organizing map network is 10000 samples and 1200 elements. The output layer is set to 5 × 5, 25 in 2 dimensions. Training was performed using the neural net clustering in MATLAB 2019. SOM: Self-organizing map.

