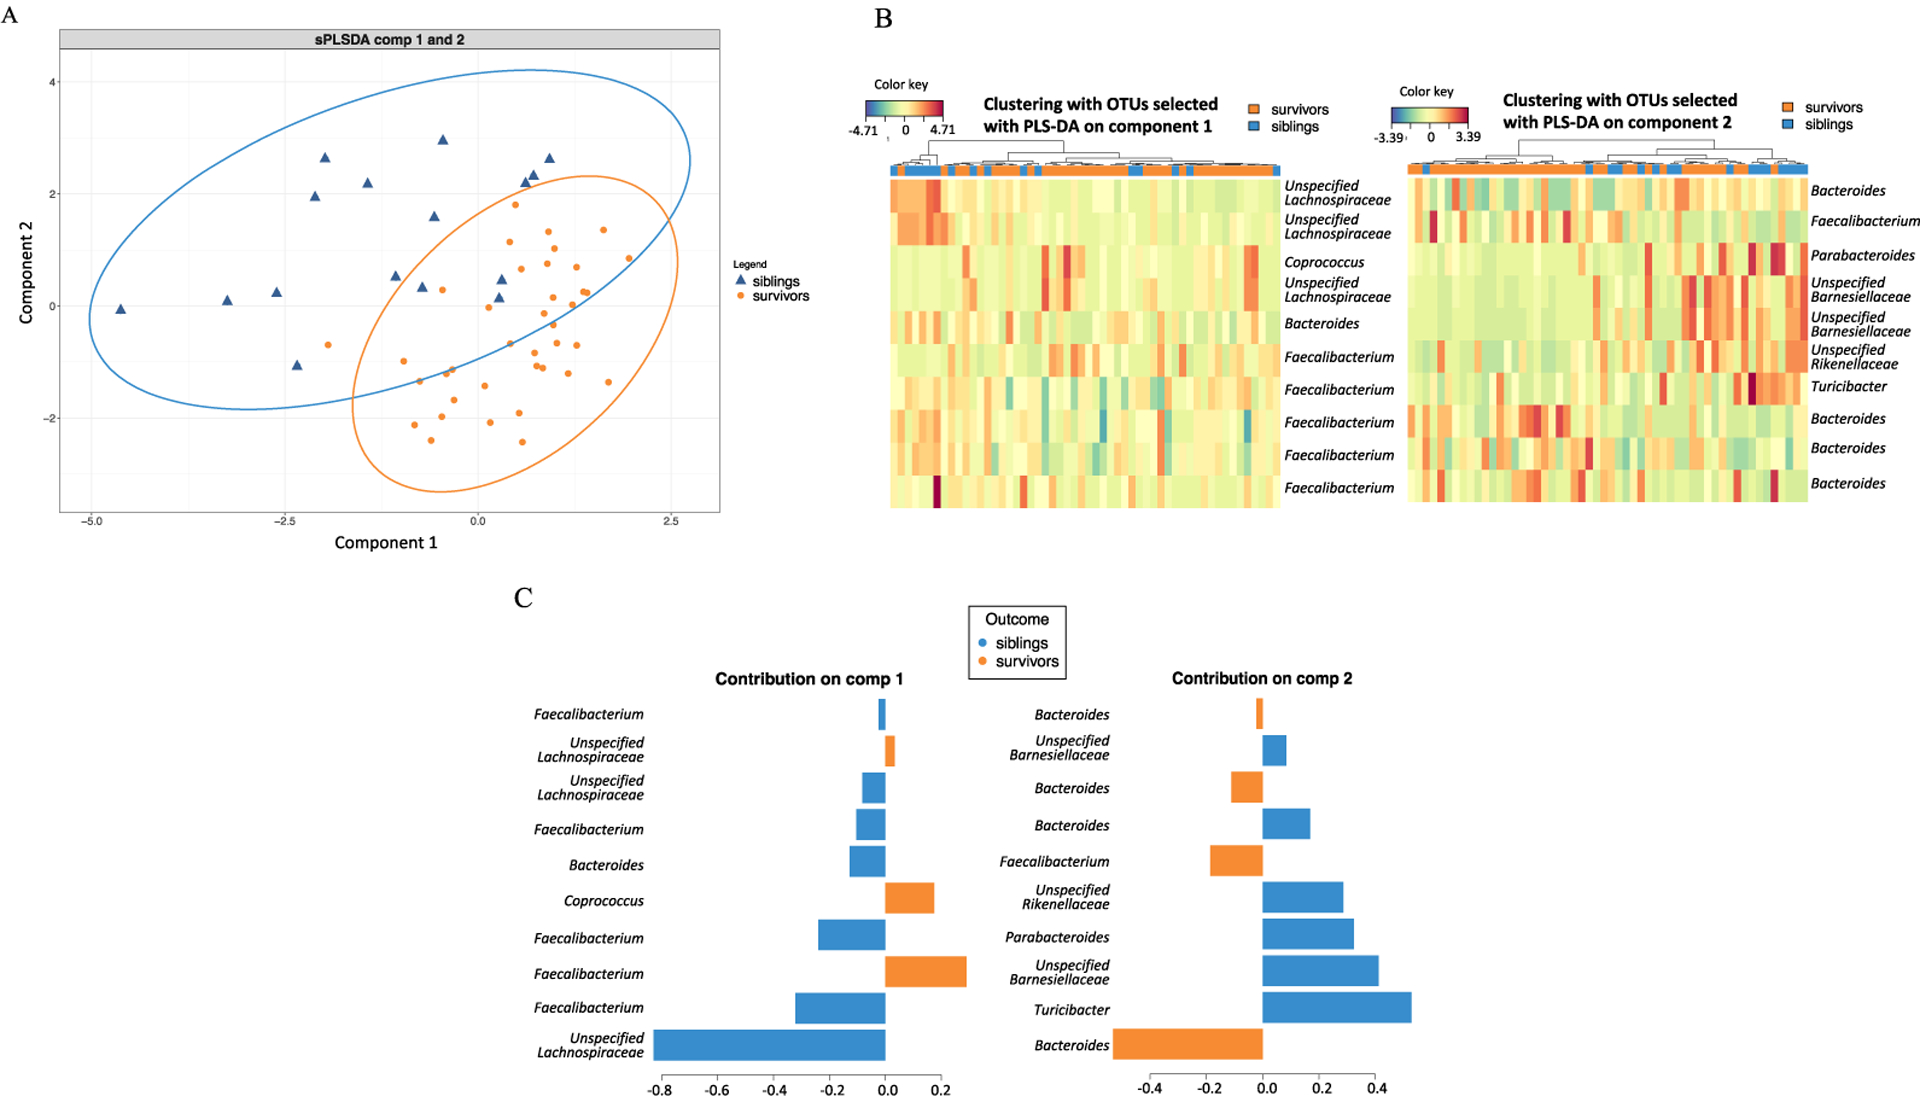
Figure 3.

A. sPLS-DA analysis of the 2 groups, survivors and siblings, based on the top 10 OTUs most different between survivors and siblings. B. Clustering heatmaps of 10 selected OTUs from sPLS-DA plot component 1 and 2, labeled with genus name when known, or unspecified family name when genus could not be identified. C. Contribution plot showing the contribution of the 10 OTUs from component 1 and 2 of survivors and siblings.
