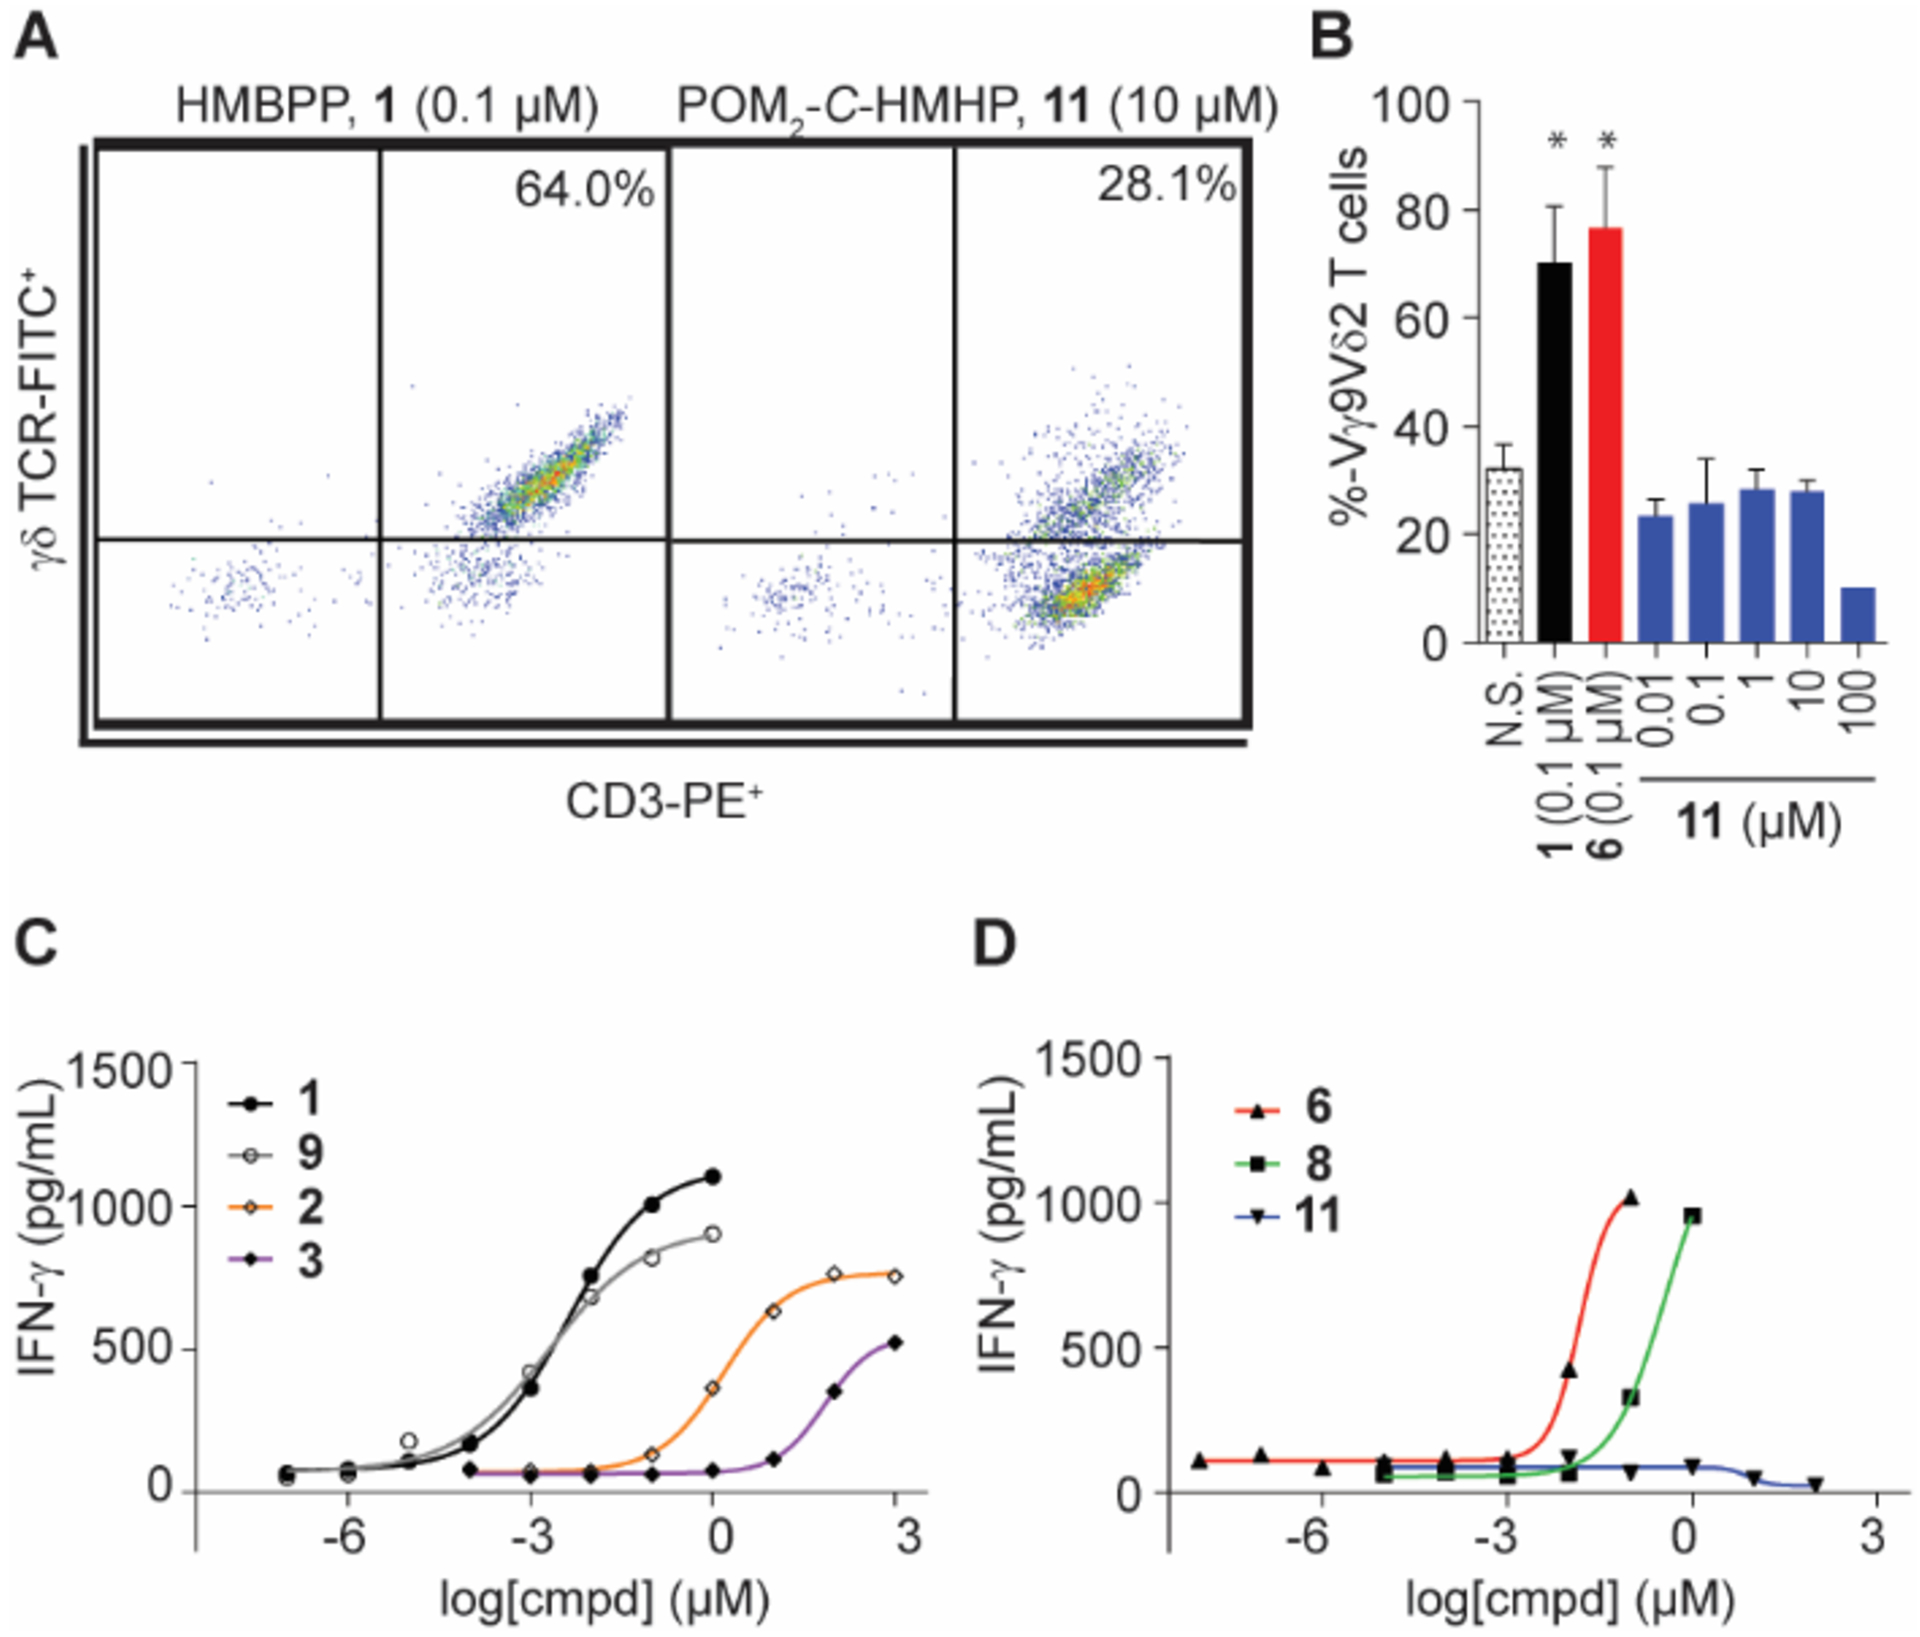
Figure 4.

Cellular activity of butyrophilin ligands 10 and 11. (A) Representative population and (B) quantification of γδ T cell proliferation by flow cytometry analysis. Data represents mean +/− SD. (C-D) Quantification of PBMC IFN-γ production of butyrophilin ligands determined by ELISA. Results reported in Table 1; n = 5, *p < 0.05, ANOVA.
