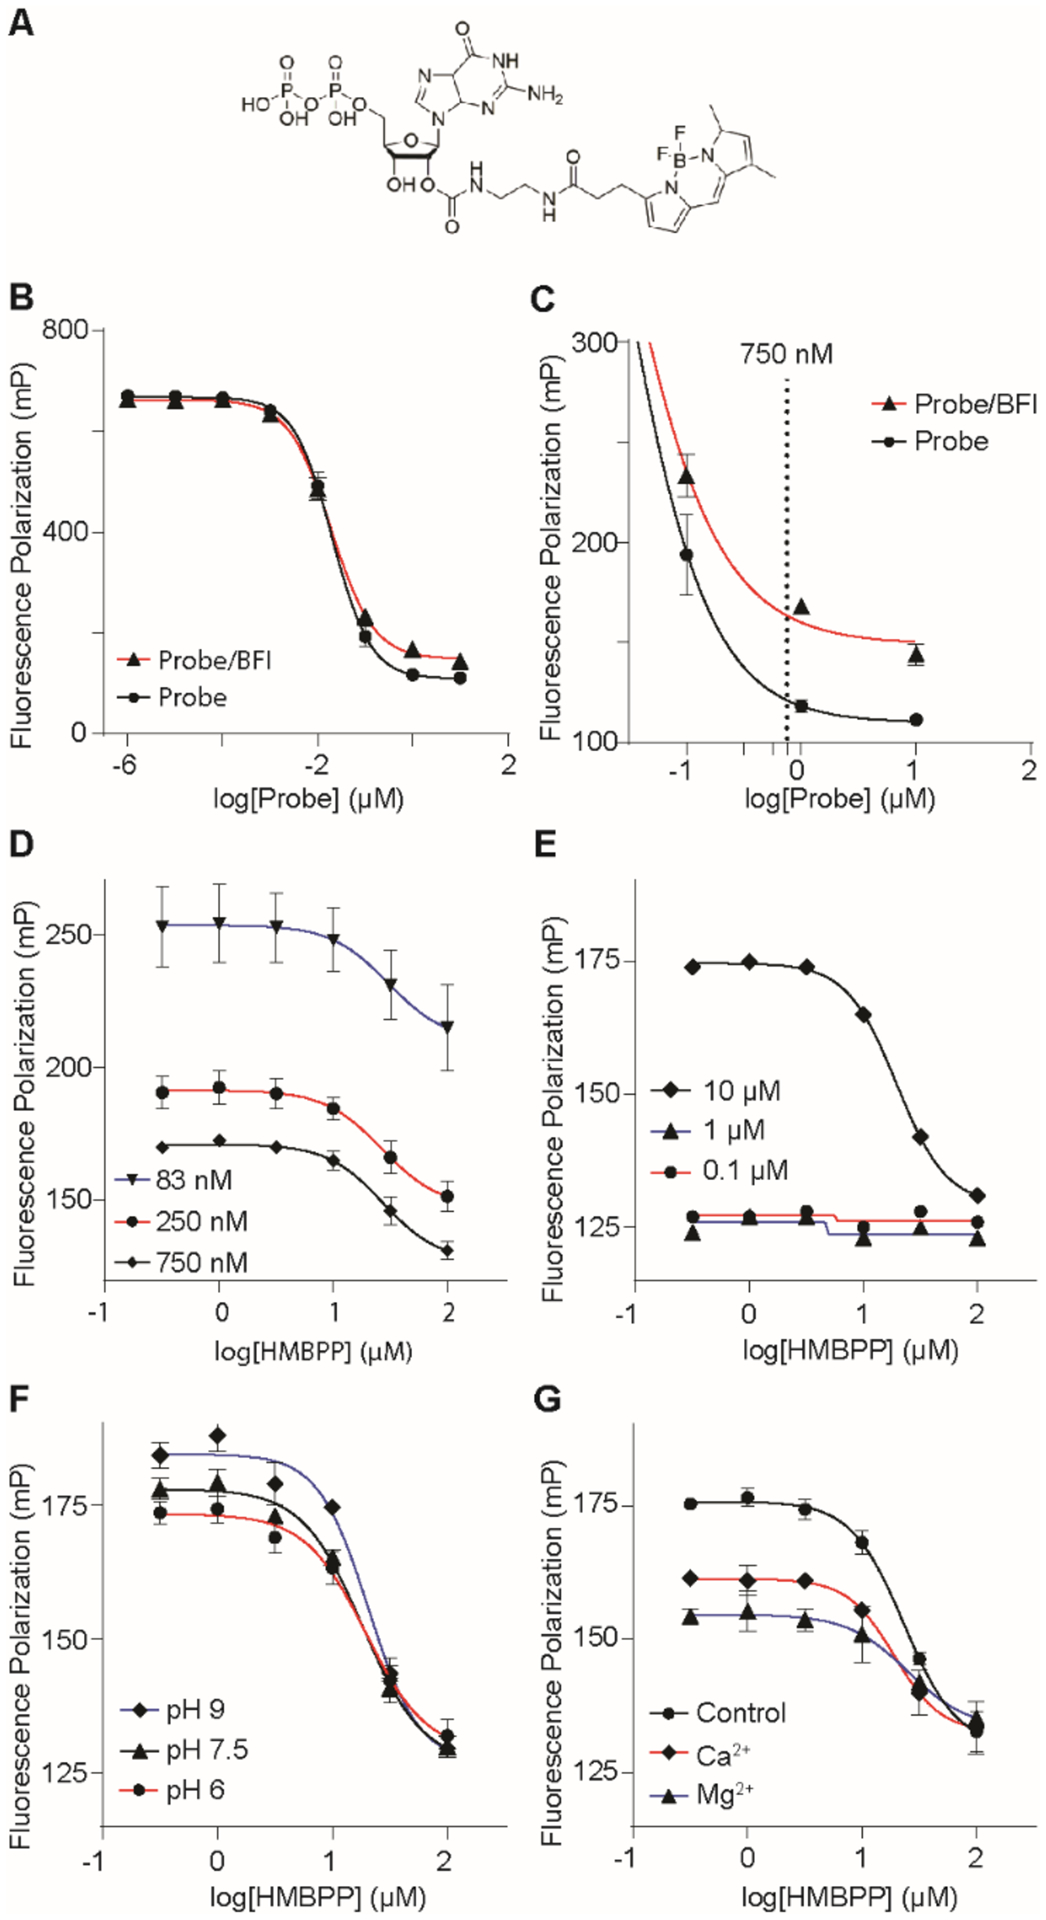
Figure 5.

Optimization of a fluorescence polarization assay to assess BTN3A1 ligand binding. (A) Structure of the GDP-BODIPY probe. Optimization of the fluorescence polarization assay involved varying probe (B-D) and BFI (E) concentrations. pH (F) and divalent cation (G) effects were also investigated. Data represents mean +/− SD.
