
FIG 5.
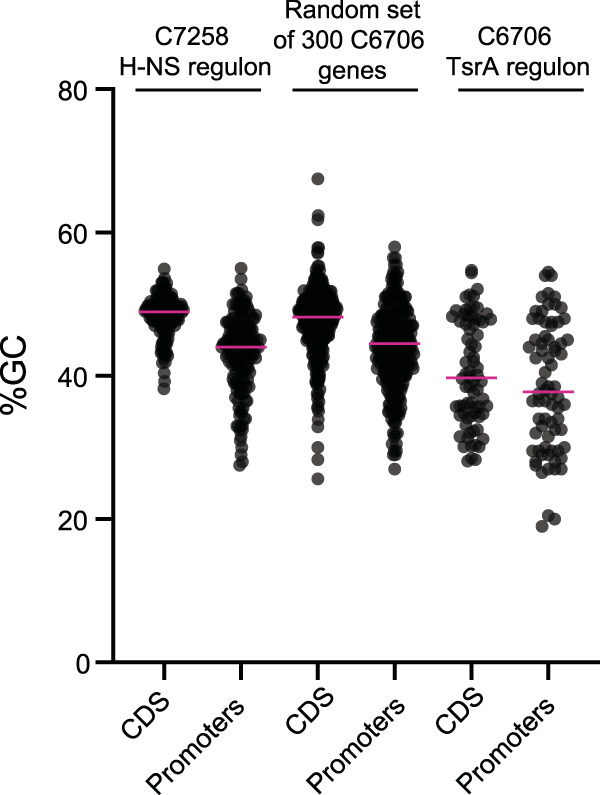
The DNA sequences of TsrA regulon members are AT rich. Shown are the GC percentages of either the coding sequences (CDS) or the 200-nucleotide upstream regions of members of the C7258 H-NS regulon (including only those genes negatively regulated by H-NS), the C6706 TsrA regulon, or a randomly selected set of 300 C6706 genes. Pink horizontal lines represent the mean of each distribution.