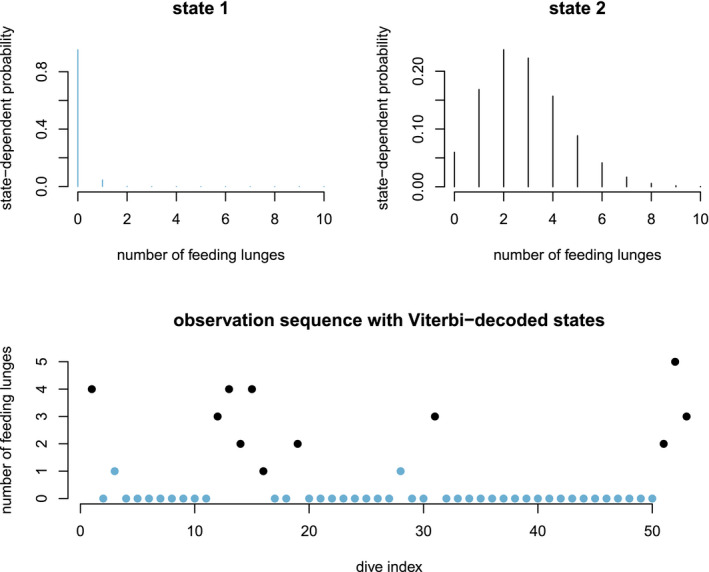
Figure 3.

Estimated state‐dependent distributions (top row) and Viterbi‐decoded states from a two‐state HMM fitted to counts of feeding lunges performed by a blue whale during a sequence of consecutive dives. Here the most likely state sequence identifies periods of ‘low’ (state 1; blue) and ‘high’ (state 2; black) feeding activity.
