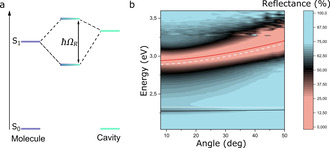
Figure 3.

a) Energy diagram showing how the molecular transition couples to a cavity mode to form the two polaritonic states, the upper (UP) and lower (LP) polaritons. b) Angle resolved reflectivity of the optical cavity, red and black line show a fit to a coupled oscillator model, which as used to extract the coupling strength, where the black line shows the lower polariton, the red line the upper polariton, the white dashed line the energy of the cavity mode, and the white dotted line the transition energy of the molecule.
