Figure 5.

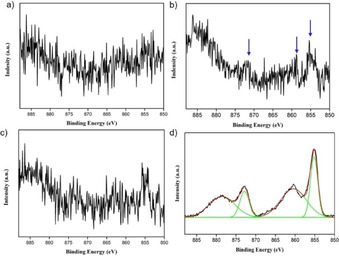
High‐resolution Ni 2p XPS spectra of the FTO electrode after 5 h of controlled potential electrolysis at 1.55 V vs. NHE of 1.0 mM NiMeso in a 0.1 M pH 7.0 phosphate buffer with stirring (a), without stirring (b), with stirring and pH tuning to 8.5 (c), and without stirring and with pH tuning to 8.5 (d).
