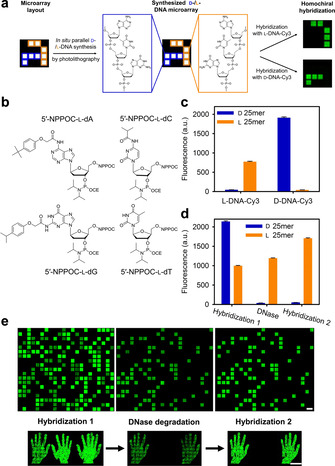
Figure 1.

a) Schematic representation of a chimeric l‐/d‐DNA microarray with close‐up structural view of a trinucleotide section (3′‐GTA‐5′). b) Structures of l‐DNA phosphoramidites used in this study. c) Average signal intensities, in arbitrary units (a.u.), for hybridization of either l‐ or d‐DNA Cy3‐labelled probe to a l‐ (orange) or d‐DNA 25‐mer (blue) of the same sequence. d) Signal intensities for l‐ and d‐DNA after hybridization with a mix of Cy3‐labelled l‐ and d‐complement (Hybridization 1), following enzymatic degradation (DNase), and after rehybridization with the mix (Hybridization 2). e) Excerpt of scans of two arrays with either randomly distributed features (top) or l‐ and d‐pixels arranged in the shape of a left and a right hand (bottom), showing d‐DNA features with high signal intensities after initial hybridization (left), but disappearing after TURBO DNase treatment (center) and only l‐DNA features remaining after repetition of hybridization (right) (scale bars: 100 μm).
