
Figure 7.
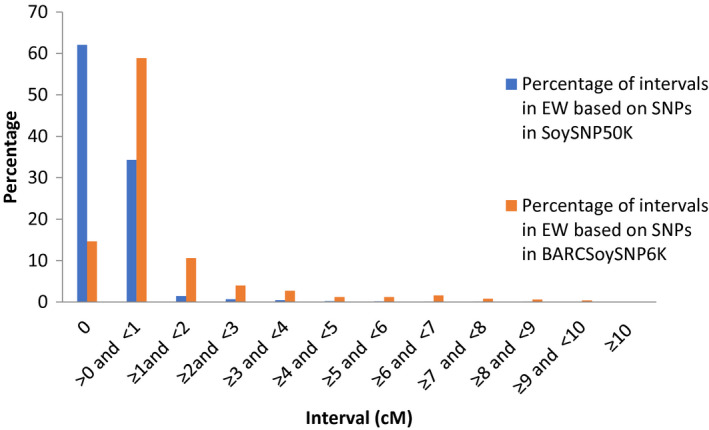
Percentage of intervals between adjacent single nucleotide polymorphisms (SNPs) in the linkage maps constructed based on the SNPs in SoySNP50K and BARCSoySNP6K in Essex × Williams 82 population.
Official websites use .gov
A
.gov website belongs to an official
government organization in the United States.
Secure .gov websites use HTTPS
A lock (
) or https:// means you've safely
connected to the .gov website. Share sensitive
information only on official, secure websites.
Percentage of intervals between adjacent single nucleotide polymorphisms (SNPs) in the linkage maps constructed based on the SNPs in SoySNP50K and BARCSoySNP6K in Essex × Williams 82 population.