
Figure 2.
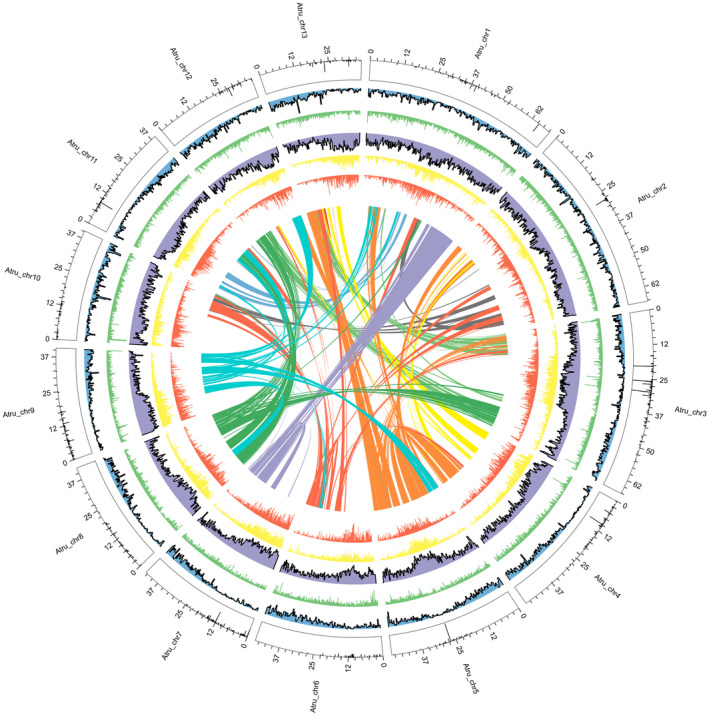
Circos plot of the genomic features of Acer truncatum. Concentric circles, from innermost to outermost, show: intra‐genome collinear blocks connected by curved lines, LTR‐Gypsy density (red), LTR‐Copia density (yellow), transposon element density (purple), tandem repeats density (green), and gene density (blue). The outermost circle displays the narrow peaks which represent centromeric regions. All distributions are drawn in a window size of 300 kb, chromosomes_units = 500 000.