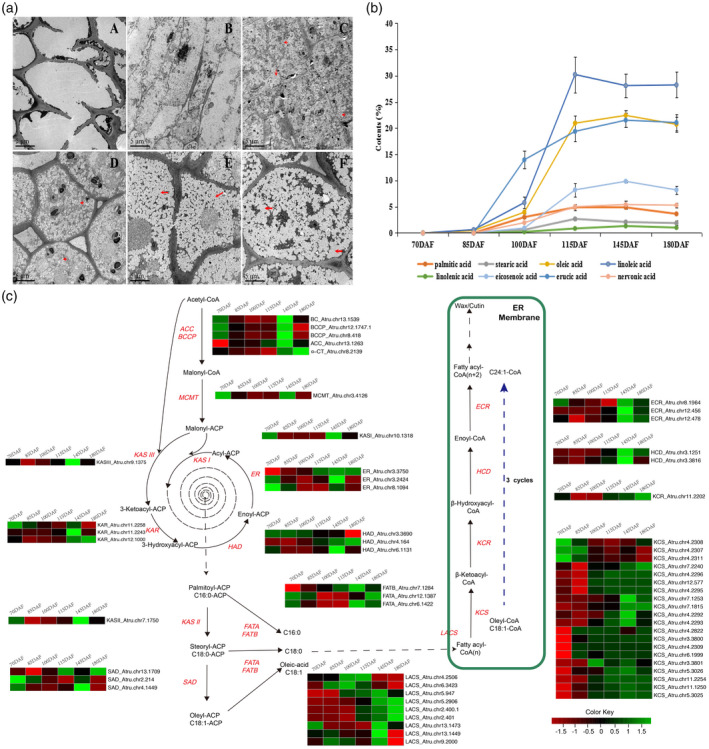
Figure 4.

Detailed biosynthetic pathways of VLCFA in A. truncatum. (a) Oil bodies in seed cells, as observed by electron microscopy, at (A) 70, (B) 85, (C) 100, (D) 115, (E) 145, and (F) 180 DAF. (b) The extraction and determination of fatty acid contents in A. truncatum seeds after flowering. The x‐axis indicates the time after flowering (in days) and the y‐axis indicates the oil content (in %). (c) Different columns of each heat map indicate different numbers of days of seed development (70–180 DAF). Gene expression levels (log10(RPKM + 1)) in five tissues are represented by color gradation. Gene expression with RPKM ≤ 1 was set to 0 after log10 transformation. Genes with more than one homologous gene are represented by equally colored horizontal stripes and are termed from top to bottom. ACC: acetyl‐CoA carboxylase; BC: biotin carboxylase; BCCP: biotin carboxyl carrier protein; ER: enoyl‐ACP reductase; HAD: hydroxyacyl‐ACP dehydrase; KAR: ketoacyl‐ACP reductase; KASI, II, and III: ketoacyl‐ACP synthase I, II, and III; MCMT: malonyl‐CoA:acyl carrier protein (ACP) malonyltransferase; α‐CT: α‐carboxyltransferase; SAD: stearoyl‐ACP desaturase; FATA (B): fatty acyl thioesterase A (B); LACS: long‐chain acyl‐CoA synthetase; KCS: ketoacyl‐CoA synthase; KCR: ketoacyl‐CoA reductase; HCD: hydroxyacyl‐CoA dehydrase; ECR: enoyl‐CoA reductase.
