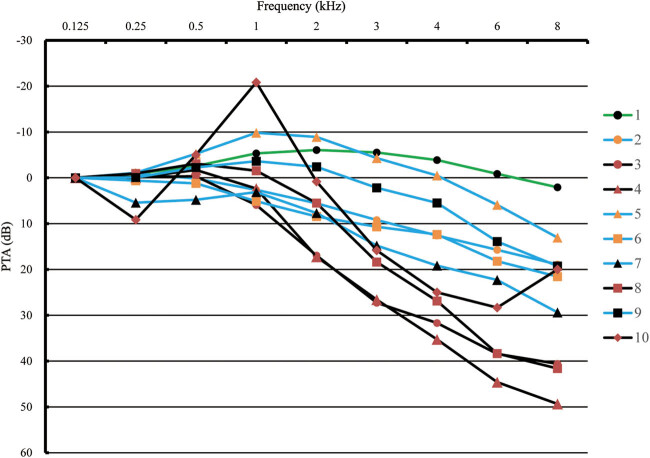
Figure 1.
Ten audiogram patterns of hearing loss group classified by K-mean cluster analysis. All audiogram shapes are calibrated at 0.125 kHz for facilitating comparison. Hearing loss cases are divided into three subgroups: flat shape (line 1), 2–4 kHz AL shape (lines 3, 4, 8 and 10) and sloping shape (lines 2, 5, 6, 7 and 9).

