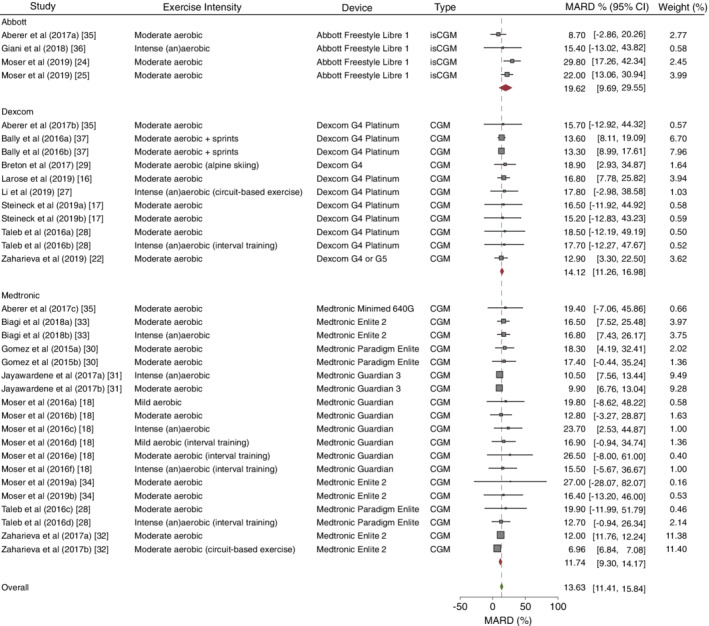
FIGURE 1.

MARD (%) of current CGM and isCGM devices during exercise. MARD data are weighted for the number of participants and SD of MARD for different manufacturers of all CGM and isCGM devices. The dashed line and the green diamond represent the MARD of all CGM and isCGM devices. Red diamonds represent the MARD for each specific company. Horizontal bars represent the 95% CIs for the specific studies. All types of studies using CGM and/or isCGM during exercise in people with type 1 diabetes were included (the studies by Giani et al [36] and Breton et al [29] were performed in children and adolescents). This figure is available as part of a downloadable slideset
