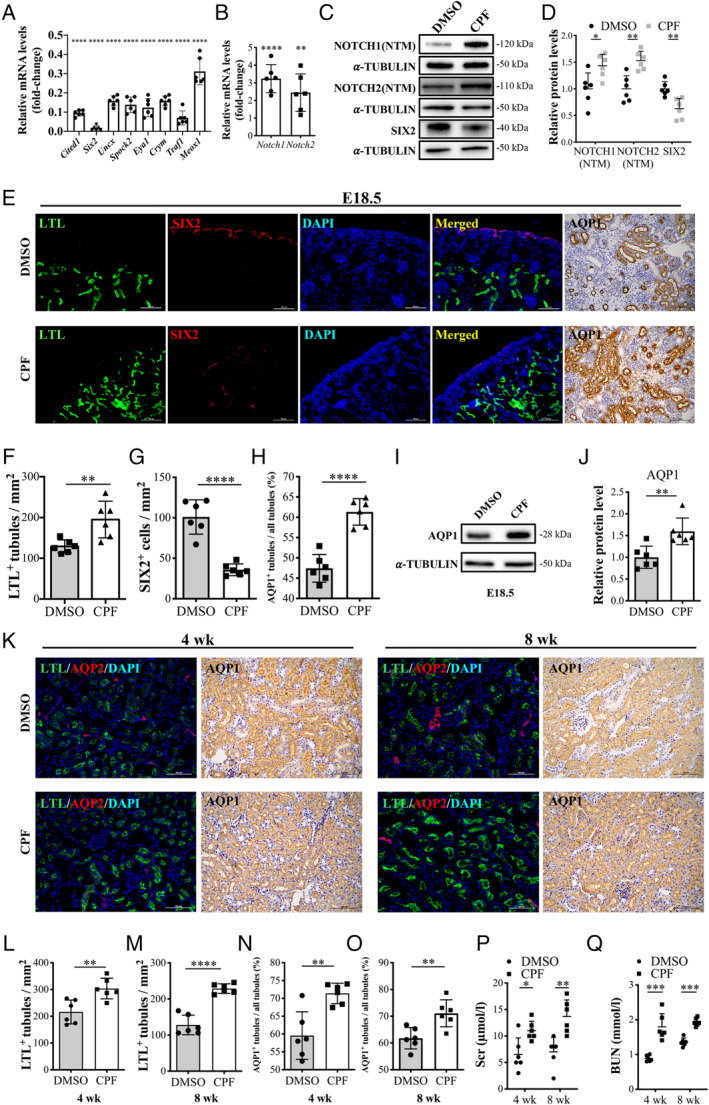
Figure 2.

Overexpression of Notch1 and Notch2 in the CPF group results in ectopic formation of PTs. (A) mRNA levels of NPC genes and (B) Notch1 and Notch2. n = 6. (C, D) Representative immunoblot images and quantification analysis of Notch1, Notch2, and Six2 of E18.5 kidneys. n = 6. (E) E18.5 kidney fluorescence detection of Lotus tetragonolobus lectin (LTL) binding (green) and Six2 (red), and immunohistochemistry for Aqp1. Scale bars: 100 μm. (F–H) Quantification of the LTL+ tubule numbers, Six2+ cell numbers, and Aqp1+ tubule numbers (n = 6). (I, J) The protein level of Aqp1 in E18.5 kidneys. n = 6. (K) Four‐ and 8‐week immunofluorescence detection of LTL binding (green) and Aqp2 (red), and immunohistochemistry for Aqp1. Scale bars: 100 μm. (L–O) Quantification of LTL+ tubule numbers and Aqp1+ tubule numbers in 4‐ and 8‐week kidneys for the two groups (n = 6). (P, Q) Serum creatinine and blood urea nitrogen levels of 4‐ and 8‐week mice of the CPF group compared with DMSO controls. Mean ± SD from three to five experiments. ****p < 0.0001, ***p < 0.001, **p < 0.01, *p < 0.05.
