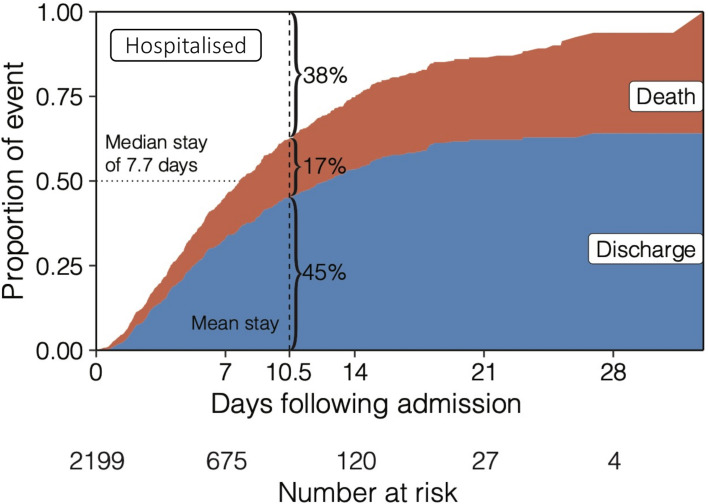
Figure 2.
Cumulative incidence function displays the probability of mutually exclusive events of discharge (blue) or death (red) by a given day of hospitalisation, accounting for the changing number of patients at risk including censoring. The remaining portion (white) shows patients that are still hospitalised, where the median length of stay is 7.7 days.

