
FIGURE 1.
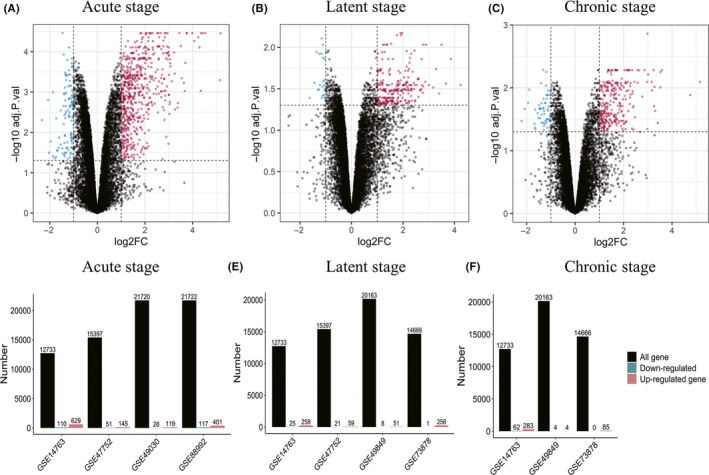
Gene expression distributions of microarrays in three stages of epilepsy. (A‐C): Representative volcano plots of the microarrays in the acute, latent, and chronic stages (GSE14763). Red points represented up‐regulated genes, while blue points represented down‐regulated genes. Black points indicate genes with no significant difference. (D‐F): Barplots of gene expression distributions of microarrays in the acute, latent, and chronic stages. Numbers of total genes, up‐regulated genes, and down‐regulated genes of each microarray were labeled at the top of the barplots